


Risultati trimestrali
· TSLA
TSLA Nasdaq Automobile Manufacturers Finanza ES2016–ES2025
Tesla's revenue fell 2.9% to $94.8 billion in fiscal 2025. Its operating margin was 4.6%, down from 7.2% a year earlier. Free cash flow was $6.2 billion, up 73.7%. The diluted share count rose 0.9%.
Su questi dati. Total debt is the balance sheet's long-term debt plus its current debt line. Share counts and per-share figures for earlier years are restated for stock splits (3-for-1 and 5-for-1), so every year is on today's share basis.
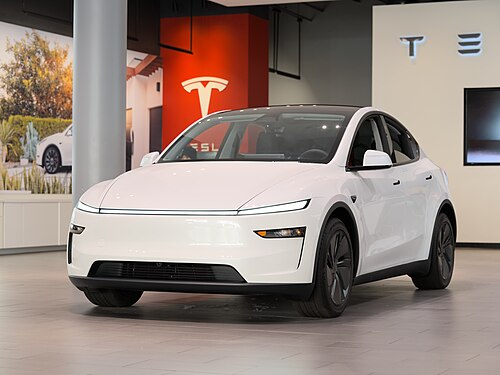
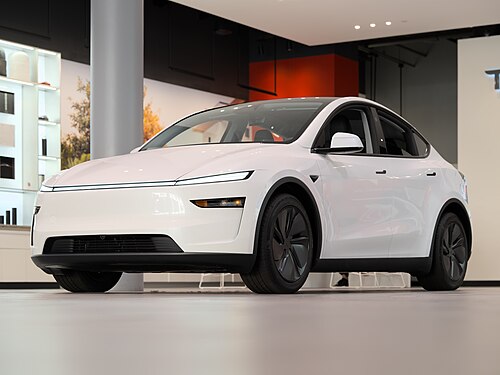
Tesla designs, builds, sells and leases electric vehicles: the Model 3, Model Y, Model S, Model X and Cybertruck, plus the Tesla Semi truck for businesses. It mostly sells straight to buyers through its website and its own stores rather than through dealers. It also makes home and utility-scale batteries (Powerwall and Megapack) and solar panels, and runs Robotaxi, a self-driving ride-hailing service it launched in June 2025.
Tesla reports two segments. Automotive covers new and used car sales, leases, sales of regulatory credits to other carmakers, paid Supercharger sessions, insurance, parts and service. Energy generation and storage covers its batteries, solar products and related services. Tesla says it now focuses on bringing artificial intelligence into the real world, through its Full Self-Driving (Supervised) driver-assistance software, Robotaxi and Optimus, a humanoid robot in development.
In 2025 Tesla delivered about 1.64 million consumer vehicles and deployed 46.7 GWh of energy storage. It has factories in California, Nevada, New York, Texas, China and Germany, and at the end of 2025 it had 134,785 employees worldwide.
Tesla ha registrato $94,8 Mrd di ricavi nell'esercizio 2025, in calo del 2,9% rispetto all'anno precedente.
I periodi in perdita sono in rosso.
Utile operativo al netto delle imposte in rapporto al capitale investito nell'attività: debito più patrimonio netto, meno liquidità.
Il free cash flow è stato di $6,2 Mrd nell'esercizio 2025, il 6,6% dei ricavi. Flusso di cassa operativo meno investimenti.
Tesla ha restituito $0,0 Mln agli azionisti nell'esercizio 2025, il 0% del free cash flow. Il numero di azioni diluite è salito del 0,9%.
Modifica le ipotesi e guarda cosa implicano per azione. Sono modelli, non previsioni né prezzi obiettivo: il risultato dipende interamente da ciò che inserisci.
Valore per azione
—
Aggiunge una liquidità netta di $37,3 Mrd e divide per 3.528,0 Mln azioni diluite. Dieci anni di flussi di cassa più un valore terminale, attualizzati a oggi.
Valore per azione
—
Multipli di riferimento: oggi — · concorrenti — · settore 17,8x.
Liquidità, debito e gli indici che mostrano quanto agevolmente Tesla può sostenerlo.
| Chiusura dell'esercizio | ES21 | ES22 | ES23 | ES24 | ES25 |
|---|---|---|---|---|---|
| Liquidità e investimenti a breve termine | $17,7 Mrd | $22,2 Mrd | $29,1 Mrd | $36,6 Mrd | $44,1 Mrd |
| Debito incl. leasing finanziari | $5,7 Mrd | $2,1 Mrd | $3,3 Mrd | $5,9 Mrd | $6,8 Mrd |
| Debito netto / EBITDA | −1,4x | −1,3x | −2,1x | −2,7x | −4,0x |
| Debito / patrimonio netto | 0,2x | 0,1x | 0,1x | 0,1x | 0,1x |
| Copertura degli interessi | 17,6x | 71,5x | 57,0x | 20,2x | 12,9x |
| Indice di liquidità corrente | 1,4x | 1,5x | 1,7x | 2,0x | 2,2x |
| Indice di liquidità immediata | 1,1x | 1,1x | 1,3x | 1,6x | 1,8x |
| Totale attività | $62,1 Mrd | $82,3 Mrd | $106,6 Mrd | $122,1 Mrd | $137,8 Mrd |
| Totale passività | $30,5 Mrd | $36,4 Mrd | $43,0 Mrd | $48,4 Mrd | $54,9 Mrd |
| Patrimonio netto | $30,2 Mrd | $44,7 Mrd | $62,6 Mrd | $72,9 Mrd | $82,1 Mrd |
| Debito netto (− = liquidità netta) | −$12,0 Mrd | −$20,1 Mrd | −$25,8 Mrd | −$30,7 Mrd | −$37,3 Mrd |
Acquisti e vendite sul mercato di dirigenti, amministratori e azionisti con oltre il 10%, dai Form 4. «Piano» indica le operazioni eseguite nell'ambito di un piano Rule 10b5-1 stabilito in anticipo.
Acquisti, 12 mesi
$0,0 Mln
0 insider
Vendite, 12 mesi
$87,7 Mln
4 insider
Delle vendite, tramite piani
66%
$58,0 Mln
| Data | Insider | Operazione | Azioni | Prezzo | Controvalore | Documento |
|---|---|---|---|---|---|---|
| 8 set 2026 | Vaibhav TanejaChief Financial Officer | Vendite | 2.606 | $360,13 | $0,9 Mln | Form 4 |
| 8 giu 2026 | Vaibhav TanejaChief Financial Officer | Vendite | 2.606 | $402,20 | $1,0 Mln | Form 4 |
| 13 mag 2026 | Vaibhav TanejaChief Financial Officer | Vendite piano | 3.000 | $450,00 | $1,4 Mln | Form 4 |
| 30 apr 2026 | Kathleen Wilson-ThompsonDirector | Vendite piano | 26.409 | $378,11 | $10,0 Mln | Form 4 |
| 30 mar 2026 | Kathleen Wilson-ThompsonDirector | Vendite piano | 25.809 | $359,33 | $9,3 Mln | Form 4 |
| 6 mar 2026 | Vaibhav TanejaChief Financial Officer | Vendite | 2.264 | $397,03 | $0,9 Mln | Form 4 |
| 25 feb 2026 | Kathleen Wilson-ThompsonDirector | Vendite piano | 25.731 | $415,56 | $10,7 Mln | Form 4 |
| 2 gen 2026 | James R MurdochDirector | Vendite piano | 60.000 | $445,40 | $26,7 Mln | Form 4 |
| 9 dic 2025 | Kimbal MuskDirector | Vendite | 56.820 | $450,66 | $25,6 Mln | Form 4 |
| 8 dic 2025 | Vaibhav TanejaChief Financial Officer | Vendite | 2.637 | $443,93 | $1,2 Mln | Form 4 |
Nove test superato/non superato su redditività, finanziamento ed efficienza. 8–9 è solido, 0–2 debole.
| Test | ES23 | ES24 | ES25 |
|---|---|---|---|
| L'utile netto è positivo | ✓ | ✓ | ✓ |
| Il flusso di cassa operativo è positivo | ✓ | ✓ | ✓ |
| Il rendimento delle attività è salito | ✕ | ✕ | ✕ |
| Il flusso di cassa operativo supera l'utile netto | ✕ | ✓ | ✓ |
| Il debito è sceso rispetto alle attività | ✕ | ✕ | ✕ |
| L'indice di liquidità è salito | ✓ | ✓ | ✓ |
| Il numero di azioni non è aumentato | ✕ | ✕ | ✕ |
| Il margine lordo è salito | ✕ | ✕ | ✓ |
| I ricavi sono saliti rispetto alle attività | ✕ | ✕ | ✕ |
| F-score | 3 / 9 | 4 / 9 | 5 / 9 |
| Rapporto dei ratei | 1,8% | −6,9% | −8,4% |
| Altman Z'' | 4,24 | 4,51 | 4,48 |
Ultimo esercizio di ciascuna azienda. Gli esercizi si chiudono in mesi diversi, quindi i periodi non coincidono esattamente.
| Azienda | Capitalizzazione | Crescita | Marg. op. | Margine FCF | ROIC | P/E | F-score | |
|---|---|---|---|---|---|---|---|---|
| Tesla TSLA | $1,32 Bln | −2,9% | 4,6% | 6,6% | 7,2% | — | 5 | |
| General Motors GM | $67,3 Mrd | −1,3% | 1,6% | 9,5% | 1,5% | 16,5x | 6 | Confronta → |
| Ford F | $47,2 Mrd | 1,2% | −4,9% | 6,7% | — | — | — | Confronta → |
Importi in USD. Passa il cursore sul nome di un indice per vederne la definizione.
| Esercizio | ES16 | ES17 | ES18 | ES19 | ES20 | ES21 | ES22 | ES23 | ES24 | ES25 |
|---|---|---|---|---|---|---|---|---|---|---|
| Conto economico | ||||||||||
| Ricavi | $7,0 Mrd | $11,8 Mrd | $21,5 Mrd | $24,6 Mrd | $31,5 Mrd | $53,8 Mrd | $81,5 Mrd | $96,8 Mrd | $97,7 Mrd | $94,8 Mrd |
| Utile lordo | $1,6 Mrd | $2,2 Mrd | $4,0 Mrd | $4,1 Mrd | $6,6 Mrd | $13,6 Mrd | $20,9 Mrd | $17,7 Mrd | $17,5 Mrd | $17,1 Mrd |
| Ricerca e sviluppo | $834 Mln | $1,4 Mrd | $1,5 Mrd | $1,3 Mrd | $1,5 Mrd | $2,6 Mrd | $3,1 Mrd | $4,0 Mrd | $4,5 Mrd | $6,4 Mrd |
| Utile operativo | −$667 Mln | −$1,6 Mrd | −$388 Mln | −$69,0 Mln | $2,0 Mrd | $6,5 Mrd | $13,7 Mrd | $8,9 Mrd | $7,1 Mrd | $4,4 Mrd |
| Oneri finanziari | $199 Mln | $471 Mln | $663 Mln | $685 Mln | $748 Mln | $371 Mln | $191 Mln | $156 Mln | $350 Mln | $338 Mln |
| Utile ante imposte | −$746 Mln | −$2,2 Mrd | −$1,0 Mrd | −$665 Mln | $1,2 Mrd | $6,3 Mrd | $13,7 Mrd | $10,0 Mrd | $9,0 Mrd | $5,3 Mrd |
| Imposte sul reddito | $26,7 Mln | $32,0 Mln | $58,0 Mln | $110 Mln | $292 Mln | $699 Mln | $1,1 Mrd | −$5,0 Mrd | $1,8 Mrd | $1,4 Mrd |
| Utile netto | −$675 Mln | −$2,0 Mrd | −$976 Mln | −$862 Mln | $721 Mln | $5,5 Mrd | $12,6 Mrd | $15,0 Mrd | $7,1 Mrd | $3,8 Mrd |
| EPS diluito | −$0,31 | −$0,79 | −$0,38 | −$0,33 | $0,21 | $1,63 | $3,62 | $4,30 | $2,04 | $1,08 |
| Azioni diluite | 2,16 Mrd | 2,49 Mrd | 2,56 Mrd | 2,66 Mrd | 3,25 Mrd | 3,39 Mrd | 3,48 Mrd | 3,49 Mrd | 3,50 Mrd | 3,53 Mrd |
| Flussi di cassa | ||||||||||
| Flusso di cassa operativo | −$124 Mln | −$61,0 Mln | $2,1 Mrd | $2,4 Mrd | $5,9 Mrd | $11,5 Mrd | $14,7 Mrd | $13,3 Mrd | $14,9 Mrd | $14,7 Mrd |
| Investimenti in capitale (capex) | $1,3 Mrd | $3,4 Mrd | $2,1 Mrd | $1,3 Mrd | $3,2 Mrd | $6,5 Mrd | $7,2 Mrd | $8,9 Mrd | $11,3 Mrd | $8,5 Mrd |
| Free cash flow | −$1,4 Mrd | −$3,5 Mrd | −$3,0 Mln | $1,1 Mrd | $2,8 Mrd | $5,0 Mrd | $7,6 Mrd | $4,4 Mrd | $3,6 Mrd | $6,2 Mrd |
| Ammortamenti | $477 Mln | $769 Mln | $1,2 Mrd | $1,4 Mrd | $1,6 Mrd | $2,0 Mrd | $2,4 Mrd | $3,3 Mrd | $4,1 Mrd | $5,0 Mrd |
| Compensi in azioni | $334 Mln | $467 Mln | $749 Mln | $898 Mln | $1,7 Mrd | $2,1 Mrd | $1,6 Mrd | $1,8 Mrd | $2,0 Mrd | $2,8 Mrd |
| Acquisizioni | $343 Mln | $115 Mln | $18,0 Mln | $45,0 Mln | $13,0 Mln | $0,0 Mln | $0,0 Mln | $64,0 Mln | $0,0 Mln | $0,0 Mln |
| Riacquisti di azioni | $0,0 Mln | $0,0 Mln | $0,0 Mln | $0,0 Mln | $0,0 Mln | $0,0 Mln | $0,0 Mln | $0,0 Mln | $0,0 Mln | $0,0 Mln |
| Dividendi pagati | $0,0 Mln | $0,0 Mln | $0,0 Mln | $0,0 Mln | $0,0 Mln | $0,0 Mln | $0,0 Mln | $0,0 Mln | $0,0 Mln | $0,0 Mln |
| Dividendi e riacquisti | $0,0 Mln | $0,0 Mln | $0,0 Mln | $0,0 Mln | $0,0 Mln | $0,0 Mln | $0,0 Mln | $0,0 Mln | $0,0 Mln | $0,0 Mln |
| Stato patrimoniale | ||||||||||
| Liquidità e investimenti a breve termine | $3,4 Mrd | $3,4 Mrd | $3,7 Mrd | $6,3 Mrd | $19,4 Mrd | $17,7 Mrd | $22,2 Mrd | $29,1 Mrd | $36,6 Mrd | $44,1 Mrd |
| Debito totale | $7,0 Mrd | $10,2 Mrd | $11,6 Mrd | $10,4 Mrd | $8,5 Mrd | $4,3 Mrd | $1,0 Mrd | $2,7 Mrd | $5,5 Mrd | $6,6 Mrd |
| Passività per leasing finanziari | $0,0 Mln | $0,0 Mln | $0,0 Mln | $1,6 Mrd | $1,5 Mrd | $1,5 Mrd | $1,1 Mrd | $573 Mln | $335 Mln | $223 Mln |
| Attività correnti | $6,3 Mrd | $6,6 Mrd | $8,3 Mrd | $12,1 Mrd | $26,7 Mrd | $27,1 Mrd | $40,9 Mrd | $49,6 Mrd | $58,4 Mrd | $68,6 Mrd |
| Passività correnti | $5,8 Mrd | $7,7 Mrd | $10,0 Mrd | $10,7 Mrd | $14,2 Mrd | $19,7 Mrd | $26,7 Mrd | $28,7 Mrd | $28,8 Mrd | $31,7 Mrd |
| Rimanenze | $2,1 Mrd | $2,3 Mrd | $3,1 Mrd | $3,6 Mrd | $4,1 Mrd | $5,8 Mrd | $12,8 Mrd | $13,6 Mrd | $12,0 Mrd | $12,4 Mrd |
| Immobili, impianti e macchinari, netti | $6,0 Mrd | $10,0 Mrd | $11,3 Mrd | $10,4 Mrd | $12,7 Mrd | $18,9 Mrd | $23,5 Mrd | $29,7 Mrd | $35,8 Mrd | $40,6 Mrd |
| Totale attività | $22,7 Mrd | $28,7 Mrd | $29,7 Mrd | $34,3 Mrd | $52,1 Mrd | $62,1 Mrd | $82,3 Mrd | $106,6 Mrd | $122,1 Mrd | $137,8 Mrd |
| Totale passività | $16,8 Mrd | $23,0 Mrd | $23,4 Mrd | $26,2 Mrd | $28,4 Mrd | $30,5 Mrd | $36,4 Mrd | $43,0 Mrd | $48,4 Mrd | $54,9 Mrd |
| Patrimonio netto | $4,8 Mrd | $4,2 Mrd | $4,9 Mrd | $6,6 Mrd | $22,2 Mrd | $30,2 Mrd | $44,7 Mrd | $62,6 Mrd | $72,9 Mrd | $82,1 Mrd |
| Margini | ||||||||||
| Margine lordo | 22,9% | 18,9% | 18,8% | 16,6% | 21,0% | 25,3% | 25,6% | 18,3% | 17,9% | 18,0% |
| Margine operativo | −9,5% | −13,9% | −1,8% | −0,3% | 6,3% | 12,1% | 16,8% | 9,2% | 7,2% | 4,6% |
| Margine EBITDA | −2,7% | −7,3% | 3,7% | 5,5% | 11,5% | 15,8% | 19,7% | 12,6% | 11,5% | 9,9% |
| Margine netto | −9,6% | −16,7% | −4,6% | −3,5% | 2,3% | 10,3% | 15,4% | 15,5% | 7,3% | 4,0% |
| Margine FCF | −20,1% | −29,6% | −0,0% | 4,4% | 8,8% | 9,3% | 9,3% | 4,5% | 3,7% | 6,6% |
| Rendimenti | ||||||||||
| Rendimento del capitale | −9,1% | −12,2% | −2,4% | −0,4% | 11,1% | 35,5% | 56,4% | 28,3% | 14,0% | 7,2% |
| Rendimento del capitale impiegato | −6,0% | −8,6% | −1,9% | −0,3% | 6,5% | 16,2% | 27,9% | 13,3% | 8,3% | 4,4% |
| Rendimento del patrimonio netto | −23,1% | −43,7% | −21,3% | −14,9% | 5,0% | 21,1% | 33,5% | 27,9% | 10,5% | 4,9% |
| Rendimento delle attività | −4,4% | −7,7% | −3,3% | −2,7% | 1,7% | 9,7% | 17,4% | 15,9% | 6,2% | 2,9% |
| Crescita | ||||||||||
| Crescita dei ricavi | 73,0% | 68,0% | 82,5% | 14,5% | 28,3% | 70,7% | 51,4% | 18,8% | 1,0% | −2,9% |
| Crescita dell'utile netto | — | — | — | — | — | 665,5% | 127,5% | 19,4% | −52,7% | −46,5% |
| Crescita dell'EPS | — | — | — | — | — | 676,2% | 122,1% | 18,8% | −52,6% | −47,1% |
| Crescita dell'FCF | — | — | — | — | 158,4% | 80,0% | 50,9% | −42,4% | −17,8% | 73,7% |
| Variazione del numero di azioni | 12,5% | 15,1% | 2,8% | 4,0% | 22,1% | 4,2% | 2,6% | 0,3% | 0,4% | 0,9% |
| Solidità finanziaria | ||||||||||
| Debito netto / EBITDA | — | — | 10,1x | 4,3x | −2,6x | −1,4x | −1,3x | −2,1x | −2,7x | −4,0x |
| Debito / patrimonio netto | 1,5x | 2,4x | 2,4x | 1,8x | 0,5x | 0,2x | 0,1x | 0,1x | 0,1x | 0,1x |
| Copertura degli interessi | −3,4x | −3,5x | −0,6x | −0,1x | 2,7x | 17,6x | 71,5x | 57,0x | 20,2x | 12,9x |
| Indice di liquidità corrente | 1,1x | 0,9x | 0,8x | 1,1x | 1,9x | 1,4x | 1,5x | 1,7x | 2,0x | 2,2x |
| Indice di liquidità immediata | 0,7x | 0,6x | 0,5x | 0,8x | 1,6x | 1,1x | 1,1x | 1,3x | 1,6x | 1,8x |
| Allocazione del capitale | ||||||||||
| Capex / ricavi | 18,3% | 29,0% | 9,8% | 5,4% | 10,0% | 12,0% | 8,8% | 9,2% | 11,6% | 9,0% |
| Compensi in azioni / ricavi | 4,8% | 4,0% | 3,5% | 3,7% | 5,5% | 3,9% | 1,9% | 1,9% | 2,1% | 3,0% |
| Distribuzioni / FCF | — | — | — | 0,0% | 0,0% | 0,0% | 0,0% | 0,0% | 0,0% | 0,0% |
| Punteggi di qualità | ||||||||||
| F-score di Piotroski | 5,0 | 2,0 | 5,0 | 6,0 | 8,0 | 7,0 | 8,0 | 3,0 | 4,0 | 5,0 |
| Z'' di Altman | −0,2 | −1,0 | −0,8 | −0,0 | 2,3 | 2,6 | 4,1 | 4,2 | 4,5 | 4,5 |
| Rapporto dei ratei | −3,6% | −7,4% | −10,5% | −10,2% | −12,1% | −10,5% | −3,0% | 1,8% | −6,9% | −8,4% |
Fonte: documenti SEC EDGAR XBRL (CIK 0001318605). Dati aggiornati il 22 ottobre 2026. I quarti trimestri sono l'intero anno meno i primi nove mesi. Solo a scopo informativo: non è una consulenza finanziaria. Verifica i documenti originali prima di basarti su un dato.