



Jaarcijfers
· COST
COST Nasdaq Consumer Staples Merchandise Retail Financiële sector BJ2017–BJ2026
Costco's revenue rose 10.1% to $303.2 billion in fiscal 2026. Its operating margin was 3.9%, up from 3.8% a year earlier. Free cash flow was $9.4 billion, up 19.7%. It paid out $3.3 billion in dividends and buybacks, 35% of free cash flow.
Laatste slotkoers · 23 okt. 2026
$1.003,32
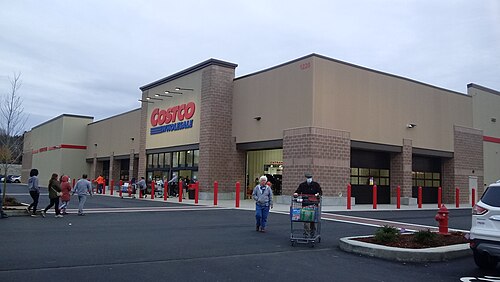
1,5%Costco runs membership warehouse stores that sell groceries, fresh food, household goods, electronics, appliances, clothing and more, along with gas stations, pharmacies, optical and hearing aid centers, and food courts. Shoppers must pay a yearly fee to join; in the United States the basic membership costs $65. It had 939 warehouses at the end of August 2026, in the United States and Puerto Rico, Canada, Mexico, Japan, the UK, Korea, Australia, Taiwan, China, New Zealand and several European countries. It also sells online in nine countries.
Costco keeps prices low by stocking fewer than 4,000 kinds of items per warehouse, buying in bulk and selling from plain, self-service buildings. It makes money on merchandise sales at thin margins and on membership fees, including from Executive members, who pay more and earn rewards on purchases. Its member renewal rate was 92.3% in the United States and Canada at the end of fiscal 2026. Gasoline made up 11% of net sales. It also sells its own Kirkland Signature brand.
Costco reports three segments by geography: the United States, Canada and other international. It names Walmart, Target, Kroger and Amazon among its significant competitors in the United States, along with other warehouse clubs such as Sam's Club and BJ's. It had 355,000 employees at the end of fiscal 2026.
Costco had in boekjaar 2026 een omzet van $303,2 mld, 10,1% meer dan een jaar eerder.
Van boekjaar 2017 tot 2026 groeide de verwaterde winst per aandeel 14,6% per jaar. Verliesperiodes staan in het rood.
Bedrijfsresultaat na belasting als deel van het geld dat in het bedrijf is geïnvesteerd: schuld plus eigen vermogen, min kas.
De vrije kasstroom was $9,4 mld in boekjaar 2026, 3,1% van de omzet. Operationele kasstroom min investeringen.
Costco keerde in boekjaar 2026 $3,3 mld uit aan aandeelhouders, 35% van de vrije kasstroom. Het aantal verwaterde aandelen daalde 0,1%.
Wijzig de aannames en zie wat ze per aandeel betekenen. Dit zijn modellen, geen voorspellingen of koersdoelen: de uitkomst hangt volledig af van wat je invoert.
Waarde per aandeel
—
Telt een netto kaspositie van $13,7 mld op en deelt door 444,4 mln verwaterde aandelen. Tien jaar kasstromen plus een eindwaarde, verdisconteerd naar vandaag.
Waarde per aandeel
—
Referentiemultiples: vandaag 48,3x · branchegenoten 20,0x · sector 24,2x.
Kas, schuld en de ratio's die laten zien hoe makkelijk Costco die kan dragen.
| Einde boekjaar | BJ22 | BJ23 | BJ24 | BJ25 | BJ26 |
|---|---|---|---|---|---|
| Kas en kortlopende beleggingen | $11,0 mld | $15,2 mld | $11,1 mld | $15,3 mld | $21,3 mld |
| Schuld incl. financiële lease | $6,6 mld | $6,5 mld | $7,4 mld | $7,3 mld | $7,6 mld |
| Nettoschuld / EBITDA | −0,5x | −0,9x | −0,3x | −0,6x | −1,0x |
| Schuld / eigen vermogen | 0,3x | 0,3x | 0,3x | 0,3x | 0,2x |
| Rentedekking | 49,3x | 50,7x | 54,9x | 67,4x | 80,6x |
| Current ratio | 1,0x | 1,1x | 1,0x | 1,0x | 1,1x |
| Quick ratio | 0,5x | 0,6x | 0,4x | 0,6x | 0,6x |
| Totaal activa | $64,2 mld | $69,0 mld | $69,8 mld | $77,1 mld | $89,0 mld |
| Totaal verplichtingen | $43,5 mld | $43,9 mld | $46,2 mld | $47,9 mld | $53,2 mld |
| Eigen vermogen | $20,6 mld | $25,1 mld | $23,6 mld | $29,2 mld | $35,8 mld |
| Nettoschuld (− = netto kas) | −$4,4 mld | −$8,8 mld | −$3,7 mld | −$8,0 mld | −$13,7 mld |
Aankopen en verkopen op de open markt door bestuurders, commissarissen en eigenaren van meer dan 10%, uit Form 4-meldingen. „Plan” markeert transacties onder een vooraf opgesteld Rule 10b5-1-plan.
Gekocht, 12 maanden
$0,0 mln
0 insiders
Verkocht, 12 maanden
$12,4 mln
9 insiders
Van de verkopen via plannen
0%
$0,0 mln
| Datum | Insider | Transactie | Aandelen | Koers | Waarde | Rapport |
|---|---|---|---|---|---|---|
| 13 okt. 2026 | William Richard WilcoxExecutive Vice President | Verkocht | 1.100 | $958,21 | $1,1 mln | Form 4 |
| 29 sep. 2026 | Caton FratesSr. Executive Vice President | Verkocht | 801 | $915,93 | $0,7 mln | Form 4 |
| 29 sep. 2026 | Claudine AdamoExecutive Vice President | Verkocht | 2.200 | $915,93 | $2,0 mln | Form 4 |
| 23 jun. 2026 | Kenneth D DenmanDirector | Verkocht | 885 | $957,45 | $0,8 mln | Form 4 |
| 1 apr. 2026 | Caton FratesExecutive Vice President | Verkocht | 700 | $993,00 | $0,7 mln | Form 4 |
| 9 mrt. 2026 | Claudine AdamoExecutive Vice President | Verkocht | 730 | $1.003,02 | $0,7 mln | Form 4 |
| 21 jan. 2026 | Teresa A. JonesExecutive Vice President | Verkocht | 850 | $986,26 | $0,8 mln | Form 4 |
| 16 jan. 2026 | Susan L DeckerDirector | Verkocht | 458 | $955,00 | $0,4 mln | Form 4 |
| 14 jan. 2026 | James C KlauerExecutive Vice President | Verkocht | 1.500 | $939,00 | $1,4 mln | Form 4 |
| 9 jan. 2026 | Russell D MillerSr. Executive Vice President | Verkocht | 1.500 | $916,32 | $1,4 mln | Form 4 |
| 30 dec. 2025 | Javier PolitExecutive Vice President | Verkocht | 558 | $862,90 | $0,5 mln | Form 4 |
| 29 dec. 2025 | Javier PolitExecutive Vice President | Verkocht | 2.049 | $867,21 | $1,8 mln | Form 4 |
Negen geslaagd/niet-geslaagd-tests van winstgevendheid, financiering en efficiëntie. 8–9 is sterk, 0–2 zwak.
| Test | BJ24 | BJ25 | BJ26 |
|---|---|---|---|
| Nettowinst is positief | ✓ | ✓ | ✓ |
| Operationele kasstroom is positief | ✓ | ✓ | ✓ |
| Rendement op activa steeg | ✓ | ✓ | ✓ |
| Operationele kasstroom hoger dan nettowinst | ✓ | ✓ | ✓ |
| Schuld daalde ten opzichte van activa | ✓ | ✓ | ✓ |
| Current ratio steeg | ✕ | ✓ | ✓ |
| Aantal aandelen steeg niet | ✕ | ✕ | ✓ |
| Brutomarge steeg | ✓ | ✓ | ✕ |
| Omzet steeg ten opzichte van activa | ✕ | ✓ | ✕ |
| F-score | 6 / 9 | 8 / 9 | 7 / 9 |
| Accrualsratio | −5,7% | −7,1% | −7,9% |
| Altman Z'' | 2,14 | 2,61 | 2,83 |
Laatste boekjaar van elk bedrijf. Boekjaren eindigen in verschillende maanden, dus de periodes vallen niet precies samen.
| Bedrijf | Beurswaarde | Groei | Oper. marge | FCF-marge | ROIC | K/W | F-score | |
|---|---|---|---|---|---|---|---|---|
| Costco COST | $445,9 mld | 10,1% | 3,9% | 3,1% | 40,7% | — | 7 | |
| Walmart WMT | $956,5 mld | 4,7% | 4,2% | 2,1% | 16,1% | 43,3x | 7 | Vergelijken → |
| Target TGT | $69,8 mld | −1,7% | 4,9% | 2,7% | 15,0% | 15,9x | 6 | Vergelijken → |
| Amazon AMZN | $2,70 bln | 12,4% | 11,2% | 1,1% | 20,6% | 20,0x | 6 | Vergelijken → |
Bedragen in USD. Beweeg over de naam van een ratio voor de definitie.
| Boekjaar | BJ17 | BJ18 | BJ19 | BJ20 | BJ21 | BJ22 | BJ23 | BJ24 | BJ25 | BJ26 |
|---|---|---|---|---|---|---|---|---|---|---|
| Winst-en-verliesrekening | ||||||||||
| Omzet | $129,0 mld | $141,6 mld | $152,7 mld | $166,8 mld | $195,9 mld | $227,0 mld | $242,3 mld | $254,5 mld | $275,2 mld | $303,2 mld |
| Brutowinst | $17,1 mld | $18,4 mld | $16,5 mld | $21,8 mld | $25,2 mld | $27,6 mld | $29,7 mld | $32,1 mld | $35,3 mld | $38,9 mld |
| Bedrijfsresultaat | $4,1 mld | $4,5 mld | $4,7 mld | $5,4 mld | $6,7 mld | $7,8 mld | $8,1 mld | $9,3 mld | $10,4 mld | $11,7 mld |
| Rentelasten | $134 mln | $159 mln | $150 mln | $160 mln | $171 mln | $158 mln | $160 mln | $169 mln | $154 mln | $145 mln |
| Winst voor belasting | $4,0 mld | $4,4 mld | $4,8 mld | $5,4 mld | $6,7 mld | $7,8 mld | $8,5 mld | $9,7 mld | $10,8 mld | $12,3 mld |
| Winstbelasting | $1,3 mld | $1,3 mld | $1,1 mld | $1,3 mld | $1,6 mld | $1,9 mld | $2,2 mld | $2,4 mld | $2,7 mld | $3,0 mld |
| Nettowinst | $2,7 mld | $3,1 mld | $3,7 mld | $4,0 mld | $5,0 mld | $5,8 mld | $6,3 mld | $7,4 mld | $8,1 mld | $9,2 mld |
| Verwaterde winst per aandeel | $6,08 | $7,09 | $8,26 | $9,02 | $11,27 | $13,14 | $14,16 | $16,56 | $18,21 | $20,76 |
| Verwaterde aandelen | 0,44 mld | 0,44 mld | 0,44 mld | 0,44 mld | 0,44 mld | 0,44 mld | 0,44 mld | 0,44 mld | 0,44 mld | 0,44 mld |
| Kasstroom | ||||||||||
| Operationele kasstroom | $6,7 mld | $5,8 mld | $6,4 mld | $8,9 mld | $9,0 mld | $7,4 mld | $11,1 mld | $11,3 mld | $13,3 mld | $15,8 mld |
| Investeringen (capex) | $2,5 mld | $3,0 mld | $3,0 mld | $2,8 mld | $3,6 mld | $3,9 mld | $4,3 mld | $4,7 mld | $5,5 mld | $6,4 mld |
| Vrije kasstroom | $4,2 mld | $2,8 mld | $3,4 mld | $6,1 mld | $5,4 mld | $3,5 mld | $6,7 mld | $6,6 mld | $7,8 mld | $9,4 mld |
| Afschrijvingen | $1,4 mld | $1,4 mld | $1,5 mld | $1,6 mld | $1,8 mld | $1,9 mld | $2,1 mld | $2,2 mld | $2,4 mld | $2,7 mld |
| Beloning in aandelen | $514 mln | $544 mln | $595 mln | $619 mln | $665 mln | $724 mln | $774 mln | $818 mln | $860 mln | $924 mln |
| Overnames | $0,0 mln | $0,0 mln | $0,0 mln | $1,2 mld | $0,0 mln | $0,0 mln | $0,0 mln | $0,0 mln | $0,0 mln | $0,0 mln |
| Inkoop eigen aandelen | $469 mln | $328 mln | $247 mln | $196 mln | $496 mln | $439 mln | $676 mln | $700 mln | $903 mln | $848 mln |
| Betaald dividend | $3,9 mld | $689 mln | $1,0 mld | $1,5 mld | $5,7 mld | $1,5 mld | $1,3 mld | $9,0 mld | $2,2 mld | $2,5 mld |
| Dividend en inkoop | $4,4 mld | $1,0 mld | $1,3 mld | $1,7 mld | $6,2 mld | $1,9 mld | $1,9 mld | $9,7 mld | $3,1 mld | $3,3 mld |
| Balans | ||||||||||
| Kas en kortlopende beleggingen | $5,8 mld | $7,3 mld | $9,4 mld | $13,3 mld | $12,2 mld | $11,0 mld | $15,2 mld | $11,1 mld | $15,3 mld | $21,3 mld |
| Totale schuld | $6,7 mld | $6,6 mld | $6,9 mld | $7,7 mld | $7,6 mld | $6,6 mld | $6,5 mld | $5,9 mld | $5,8 mld | $6,2 mld |
| Verplichtingen uit financiële lease | $0,0 mln | $0,0 mln | $0,0 mln | $688 mln | $1,1 mld | — | $0,0 mln | $1,5 mld | $1,5 mld | $1,4 mld |
| Vlottende activa | $17,3 mld | $20,3 mld | $23,5 mld | $28,1 mld | $29,5 mld | $32,7 mld | $35,9 mld | $34,2 mld | $38,4 mld | $46,6 mld |
| Kortlopende schulden | $17,5 mld | $19,9 mld | $23,2 mld | $24,8 mld | $29,4 mld | $32,0 mld | $33,6 mld | $35,5 mld | $37,1 mld | $44,0 mld |
| Voorraden | $9,8 mld | $11,0 mld | $11,4 mld | $12,2 mld | $14,2 mld | $17,9 mld | $16,7 mld | $18,6 mld | $18,1 mld | $19,3 mld |
| Materiële vaste activa, netto | $18,2 mld | $19,7 mld | $20,9 mld | $21,8 mld | $23,5 mld | $24,6 mld | $26,7 mld | $29,0 mld | $31,9 mld | $35,6 mld |
| Totaal activa | $36,3 mld | $40,8 mld | $45,4 mld | $55,6 mld | $59,3 mld | $64,2 mld | $69,0 mld | $69,8 mld | $77,1 mld | $89,0 mld |
| Totaal verplichtingen | $25,3 mld | $27,7 mld | $29,8 mld | $36,9 mld | $41,2 mld | $43,5 mld | $43,9 mld | $46,2 mld | $47,9 mld | $53,2 mld |
| Eigen vermogen | $10,8 mld | $12,8 mld | $15,2 mld | $18,3 mld | $17,6 mld | $20,6 mld | $25,1 mld | $23,6 mld | $29,2 mld | $35,8 mld |
| Marges | ||||||||||
| Brutomarge | 13,3% | 13,0% | 10,8% | 13,1% | 12,9% | 12,2% | 12,3% | 12,6% | 12,8% | 12,8% |
| Operationele marge | 3,2% | 3,2% | 3,1% | 3,3% | 3,4% | 3,4% | 3,4% | 3,7% | 3,8% | 3,9% |
| EBITDA-marge | 4,3% | 4,2% | 4,1% | 4,3% | 4,3% | 4,3% | 4,2% | 4,5% | 4,7% | 4,7% |
| Nettomarge | 2,1% | 2,2% | 2,4% | 2,4% | 2,6% | 2,6% | 2,6% | 2,9% | 2,9% | 3,0% |
| FCF-marge | 3,3% | 2,0% | 2,2% | 3,6% | 2,7% | 1,5% | 2,8% | 2,6% | 2,9% | 3,1% |
| Rendement | ||||||||||
| Rendement op kapitaal | 22,4% | 26,3% | 28,9% | 30,8% | 36,1% | 38,2% | 37,0% | 38,9% | 37,9% | 40,7% |
| Rendement op geïnvesteerd vermogen | 22,6% | 22,5% | 22,0% | 20,6% | 22,2% | 25,1% | 24,0% | 26,6% | 27,9% | 27,5% |
| Rendement op eigen vermogen | 23,4% | 26,6% | 26,1% | 23,9% | 27,9% | 30,6% | 27,5% | 30,3% | 30,7% | 28,4% |
| Rendement op activa | 7,7% | 8,1% | 8,5% | 7,9% | 8,7% | 9,5% | 9,5% | 10,6% | 11,0% | 11,1% |
| Groei | ||||||||||
| Omzetgroei | 8,7% | 9,7% | 7,9% | 9,2% | 17,5% | 15,8% | 6,8% | 5,0% | 8,2% | 10,1% |
| Groei nettowinst | 14,0% | 17,0% | 16,8% | 9,4% | 25,1% | 16,7% | 7,7% | 17,1% | 9,9% | 13,9% |
| Groei winst per aandeel | 14,1% | 16,6% | 16,5% | 9,2% | 24,9% | 16,6% | 7,8% | 17,0% | 10,0% | 14,0% |
| FCF-groei | 556,9% | −33,6% | 19,7% | 80,2% | −11,3% | −34,8% | 92,7% | −1,7% | 18,2% | 19,7% |
| Verandering aantal aandelen | −0,1% | 0,2% | 0,3% | 0,2% | 0,1% | 0,1% | −0,1% | 0,1% | 0,0% | −0,1% |
| Financiële gezondheid | ||||||||||
| Nettoschuld / EBITDA | 0,2x | −0,1x | −0,4x | −0,7x | −0,4x | −0,5x | −0,9x | −0,3x | −0,6x | −1,0x |
| Schuld / eigen vermogen | 0,6x | 0,5x | 0,5x | 0,5x | 0,5x | 0,3x | 0,3x | 0,3x | 0,3x | 0,2x |
| Rentedekking | 30,7x | 28,2x | 31,6x | 34,0x | 39,2x | 49,3x | 50,7x | 54,9x | 67,4x | 80,6x |
| Current ratio | 1,0x | 1,0x | 1,0x | 1,1x | 1,0x | 1,0x | 1,1x | 1,0x | 1,0x | 1,1x |
| Quick ratio | 0,4x | 0,5x | 0,5x | 0,6x | 0,5x | 0,5x | 0,6x | 0,4x | 0,6x | 0,6x |
| Kapitaalallocatie | ||||||||||
| Capex / omzet | 1,9% | 2,1% | 2,0% | 1,7% | 1,8% | 1,7% | 1,8% | 1,9% | 2,0% | 2,1% |
| Aandelenbeloning / omzet | 0,4% | 0,4% | 0,4% | 0,4% | 0,3% | 0,3% | 0,3% | 0,3% | 0,3% | 0,3% |
| Uitkeringen / FCF | 103,5% | 36,3% | 38,3% | 27,7% | 116,3% | 55,3% | 28,6% | 147,0% | 39,4% | 35,2% |
| Kwaliteitsscores | ||||||||||
| Piotroski F-score | 7,0 | 7,0 | 5,0 | 6,0 | 5,0 | 7,0 | 7,0 | 6,0 | 8,0 | 7,0 |
| Altman Z'' | 1,7 | 1,9 | 2,0 | 2,3 | 1,9 | 2,2 | 2,5 | 2,1 | 2,6 | 2,8 |
| Accrualsratio | −11,6% | −6,8% | −6,3% | −9,6% | −6,9% | −2,5% | −7,2% | −5,7% | −7,1% | −7,9% |
Bron: SEC EDGAR XBRL-rapporten (CIK 0000909832). Gegevens bijgewerkt op 9 oktober 2026. Vierde kwartalen zijn het hele jaar min de eerste negen maanden. Uitsluitend ter informatie: geen beleggingsadvies. Controleer de oorspronkelijke rapporten voordat je op een cijfer vertrouwt.