




Resultats trimestrals
· DPZ
DPZ Nasdaq Restaurants Finances EF2016–EF2025
Domino's revenue rose 5.0% to $4.9 billion in fiscal 2025. Its operating margin was 19.3%, up from 18.7% a year earlier. Free cash flow was $672 million, up 31.1%. It paid out $595 million in dividends and buybacks, 89% of free cash flow. The diluted share count fell 2.1%.
Sobre aquestes xifres. Total debt is Domino's long-term debt and finance leases including the current portion; the SEC data's plain long-term debt tag holds only a small part of it.
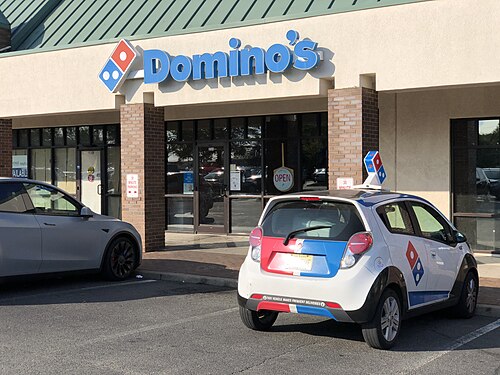
Domino's sells pizza for delivery and carryout, along with sides such as bread, wings, chicken, pasta, sandwiches and desserts. It has more than 22,100 stores in over 90 markets, and about 99% of them are owned and run by independent franchisees. In the US, more than 85% of its sales in 2025 came through digital channels such as its website and app.
Domino's makes money mainly by charging franchisees royalties, a share of their sales, and fees, by selling them dough, cheese and other supplies, and by running some US stores itself. Its supply chain segment, which makes dough and delivers food and supplies to stores in the US and Canada, brought in 60.5% of revenue in 2025. The US stores segment, its franchise operations and company-owned stores, brought in 32.6%, and international franchising 6.9%. In the US it competes mainly with Pizza Hut, Papa John's and Little Caesars, plus regional and local pizzerias; abroad, mainly with Pizza Hut and Papa John's.
Most stores outside the US are run by master franchisees that hold the rights to whole countries or regions. The largest, Domino's Pizza Enterprises, ran 3,524 stores in 12 markets. Domino's itself had about 10,200 employees at the end of 2025.
Domino's va tenir $4,9 mil M d'ingressos en l'exercici 2025, un 5,0% més que l'any anterior.
De l'exercici 2016 al 2025, el BPA diluït va créixer un 16,9% anual. Els períodes amb pèrdues es mostren en vermell.
Benefici operatiu després d'impostos en proporció als diners invertits en el negoci: deute més patrimoni, menys caixa.
El flux de caixa lliure va ser de $672 M en l'exercici 2025, el 13,6% dels ingressos. Flux de caixa operatiu menys inversió en capital.
Domino's va retornar $595 M als accionistes en l'exercici 2025, el 89% del flux de caixa lliure. El nombre d'accions diluïdes va baixar un 2,2%.
Canvia les hipòtesis i mira què impliquen per acció. Són models, no previsions ni preus objectiu: el resultat depèn del tot del que hi posis.
Valor per acció
—
Suma una caixa neta de −$4,7 mil M i divideix entre 34,2 M accions diluïdes. Deu anys de fluxos de caixa més un valor terminal, descomptats a avui.
Valor per acció
—
Múltiples de referència: avui 17,3x · comparables 27,9x · sector 17,9x.
Caixa, deute i les ràtios que mostren amb quina folgança el pot suportar Domino's.
| Tancament de l'exercici | EF21 | EF22 | EF23 | EF24 | EF25 |
|---|---|---|---|---|---|
| Caixa i inversions a curt termini | $148 M | $60,4 M | $114 M | $186 M | $126 M |
| Deute incl. arrendaments financers | $5,1 mil M | $5,0 mil M | $5,0 mil M | $5,0 mil M | $4,8 mil M |
| Deute net / EBITDA | 5,8x | 5,9x | 5,4x | 5,0x | 4,5x |
| Cobertura d'interessos | 4,1x | 3,9x | 4,2x | 4,5x | 4,9x |
| Ràtio de liquiditat | 1,5x | 1,5x | 1,5x | 0,6x | 1,7x |
| Prova àcida | 1,3x | 1,3x | 1,3x | 0,5x | 1,5x |
| Actiu total | $1,7 mil M | $1,6 mil M | $1,7 mil M | $1,7 mil M | $1,7 mil M |
| Passiu total | $5,9 mil M | $5,8 mil M | $5,7 mil M | $5,7 mil M | $5,6 mil M |
| Patrimoni net | −$4,2 mil M | −$4,2 mil M | −$4,1 mil M | −$4,0 mil M | −$3,9 mil M |
| Deute net (− = caixa neta) | $4,9 mil M | $5,0 mil M | $4,9 mil M | $4,8 mil M | $4,7 mil M |
Compres i vendes en mercat obert de directius, consellers i accionistes amb més del 10 %, segons els Form 4. «Pla» marca les operacions fetes sota un pla Rule 10b5-1 acordat per endavant.
Compres, 12 mesos
$0,0 M
0 directius
Vendes, 12 mesos
$10,5 M
6 directius
De les vendes, sota plans
62%
$6,4 M
| Data | Directiu | Operació | Accions | Preu | Import | Informe |
|---|---|---|---|---|---|---|
| 22 de jul. de 2026 | Kelly E GarciaEVP, Chief Tech & Data Ofcr | Vendes | 12.430 | $322,04 | $4,0 M | Form 4 |
| 17 de jul. de 2026 | Russell J WeinerChief Executive Officer, Director | Vendes pla | 10.850 | $330,83 | $3,6 M | Form 4 |
| 16 de jul. de 2026 | Joseph Hugh JordanCOO and President-Domino's US | Vendes pla | 5.450 | $311,29 | $1,7 M | Form 4 |
| 9 de jul. de 2026 | Kelly E GarciaEVP, Chief Tech & Data Ofcr | Vendes pla | 487 | $297,01 | $0,1 M | Form 4 |
| 11 de juny de 2026 | Kelly E GarciaEVP, Chief Tech & Data Ofcr | Vendes pla | 487 | $311,74 | $0,2 M | Form 4 |
| 21 de maig de 2026 | Kelly E GarciaEVP, Chief Tech & Data Ofcr | Vendes pla | 488 | $313,16 | $0,2 M | Form 4 |
| 30 d'abr. de 2026 | Kelly E GarciaEVP, Chief Tech & Data Ofcr | Vendes pla | 488 | $332,31 | $0,2 M | Form 4 |
| 13 de març de 2026 | Cynthia A HeadenEVP, Chief Supply Chain Offr | Vendes pla | 738 | $396,50 | $0,3 M | Form 4 |
| 13 de març de 2026 | Jessica L ParrishVP, Chief Accounting Officer | Vendes pla | 47 | $396,50 | $0,0 M | Form 4 |
| 13 de març de 2026 | Reddy SandeepEVP, Chief Financial Officer | Vendes pla | 307 | $396,50 | $0,1 M | Form 4 |
| 12 de març de 2026 | Jessica L ParrishVP, Chief Accounting Officer | Vendes pla | 47 | $391,69 | $0,0 M | Form 4 |
| 12 de març de 2026 | Reddy SandeepEVP, Chief Financial Officer | Vendes pla | 253 | $391,69 | $0,1 M | Form 4 |
Nou proves d'aprovat o suspès sobre rendibilitat, finançament i eficiència. 8–9 és sòlid; 0–2, feble.
| Prova | EF23 | EF24 | EF25 |
|---|---|---|---|
| El benefici net és positiu | ✓ | ✓ | ✓ |
| El flux de caixa operatiu és positiu | ✓ | ✓ | ✓ |
| Va pujar la rendibilitat sobre actius | ✓ | ✓ | ✕ |
| El flux de caixa operatiu supera el benefici net | ✓ | ✓ | ✓ |
| El deute va baixar en relació amb els actius | ✓ | ✓ | ✓ |
| Va pujar la ràtio de liquiditat | ✓ | ✕ | ✓ |
| No va augmentar el nombre d'accions | ✓ | ✓ | ✓ |
| Va pujar el marge brut | ✓ | ✓ | ✓ |
| Els ingressos van pujar en relació amb els actius | ✓ | ✓ | ✓ |
| F-score | 9 / 9 | 8 / 9 | 8 / 9 |
| Ràtio de meritacions | −4,4% | −2,4% | −11,0% |
| Altman Z'' | −4,32 | −7,43 | −3,05 |
Últim exercici fiscal de cada empresa. Els exercicis tanquen en mesos diferents, de manera que els períodes no coincideixen exactament.
| Empresa | Capitalització | Creixement | Marge op. | Marge FCL | ROIC | PER | F-score | |
|---|---|---|---|---|---|---|---|---|
| Domino's DPZ | $10,4 mil M | 5,0% | 19,3% | 13,6% | 92,2% | 17,3x | 8 | |
| Brinker International EAT | $8,2 mil M | 7,9% | 10,7% | 9,6% | 66,0% | — | 8 | Compara → |
| Texas Roadhouse TXRH | $10,9 mil M | 9,4% | 8,1% | 5,8% | 33,0% | 26,5x | 4 | Compara → |
| Cheesecake Factory CAKE | $5,3 mil M | 4,8% | 5,0% | 4,1% | 20,5% | 29,4x | 5 | Compara → |
| Cracker Barrel CBRL | $1,5 mil M | −4,7% | −0,4% | 2,7% | — | — | — | Compara → |
Imports en USD. Passa el cursor pel nom d'una ràtio per veure'n la definició.
| Exercici fiscal | EF16 | EF17 | EF18 | EF19 | EF20 | EF21 | EF22 | EF23 | EF24 | EF25 |
|---|---|---|---|---|---|---|---|---|---|---|
| Compte de resultats | ||||||||||
| Ingressos | $2,5 mil M | $2,8 mil M | $3,4 mil M | $3,6 mil M | $4,1 mil M | $4,4 mil M | $4,5 mil M | $4,5 mil M | $4,7 mil M | $4,9 mil M |
| Benefici brut | $768 M | $866 M | $1,3 mil M | $1,4 mil M | $1,6 mil M | $1,7 mil M | $1,6 mil M | $1,7 mil M | $1,8 mil M | $2,0 mil M |
| Benefici operatiu | $454 M | $521 M | $572 M | $629 M | $726 M | $780 M | $768 M | $820 M | $879 M | $954 M |
| Despeses financeres | $110 M | $123 M | $146 M | $151 M | $172 M | $192 M | $198 M | $197 M | $196 M | $196 M |
| Benefici abans d'impostos | $345 M | $400 M | $429 M | $483 M | $555 M | $626 M | $573 M | $652 M | $722 M | $770 M |
| Impost sobre beneficis | $130 M | $122 M | $66,7 M | $81,9 M | $63,8 M | $115 M | $121 M | $133 M | $138 M | $169 M |
| Benefici net | $215 M | $278 M | $362 M | $401 M | $491 M | $511 M | $452 M | $519 M | $584 M | $602 M |
| BPA diluït | $4,30 | $5,83 | $8,35 | $9,56 | $12,39 | $13,54 | $12,53 | $14,66 | $16,69 | $17,57 |
| Accions diluïdes | 0,05 mil M | 0,05 mil M | 0,04 mil M | 0,04 mil M | 0,04 mil M | 0,04 mil M | 0,04 mil M | 0,04 mil M | 0,04 mil M | 0,03 mil M |
| Flux de caixa | ||||||||||
| Flux de caixa operatiu | $293 M | $341 M | $394 M | $497 M | $593 M | $654 M | $475 M | $591 M | $625 M | $792 M |
| Inversió en capital (capex) | $58,6 M | $90,0 M | $120 M | $85,6 M | $88,8 M | $94,2 M | $87,2 M | $105 M | $113 M | $121 M |
| Flux de caixa lliure | $234 M | $251 M | $274 M | $411 M | $504 M | $560 M | $388 M | $485 M | $512 M | $672 M |
| Depreciació i amortització | $38,1 M | $44,4 M | $53,7 M | $59,9 M | $65,0 M | $72,9 M | $80,3 M | $80,6 M | $87,7 M | $88,8 M |
| Remuneració en accions | $18,6 M | $20,7 M | $22,8 M | $20,3 M | $24,2 M | $28,7 M | $28,7 M | $37,5 M | $43,3 M | $44,6 M |
| Adquisicions | $0,0 M | $0,0 M | $0,0 M | $0,0 M | $0,0 M | $0,0 M | $0,0 M | $0,0 M | $0,0 M | $0,0 M |
| Recompres d'accions | $300 M | $1,1 mil M | $591 M | $699 M | $305 M | $1,3 mil M | $294 M | $269 M | $330 M | $358 M |
| Dividends pagats | $73,9 M | $84,3 M | $92,2 M | $106 M | $122 M | $139 M | $158 M | $170 M | $210 M | $237 M |
| Dividends i recompres | $374 M | $1,1 mil M | $683 M | $805 M | $427 M | $1,5 mil M | $451 M | $439 M | $540 M | $595 M |
| Balanç | ||||||||||
| Caixa i inversions a curt termini | $42,8 M | $35,8 M | $25,4 M | $191 M | $169 M | $148 M | $60,4 M | $114 M | $186 M | $126 M |
| Deute total | $2,2 mil M | $3,2 mil M | $3,5 mil M | $4,1 mil M | $4,1 mil M | $5,1 mil M | $5,0 mil M | $5,0 mil M | $5,0 mil M | $4,8 mil M |
| Passius per arrendament financer | $0,0 M | $0,0 M | $17,0 M | $19,7 M | $60,6 M | $76,3 M | $74,2 M | $73,5 M | $66,1 M | $62,0 M |
| Actiu corrent | $496 M | $580 M | $567 M | $788 M | $869 M | $861 M | $791 M | $817 M | $905 M | $894 M |
| Passiu corrent | $404 M | $398 M | $380 M | $454 M | $471 M | $591 M | $537 M | $547 M | $1,6 mil M | $542 M |
| Existències | $40,2 M | $40,0 M | $46,0 M | $53,0 M | $66,7 M | $68,3 M | $81,6 M | $83,0 M | $70,9 M | $79,2 M |
| Immobilitzat material, net | $139 M | $170 M | $235 M | $243 M | $297 M | $324 M | $302 M | $304 M | $301 M | $324 M |
| Actiu total | $716 M | $837 M | $907 M | $1,4 mil M | $1,6 mil M | $1,7 mil M | $1,6 mil M | $1,7 mil M | $1,7 mil M | $1,7 mil M |
| Passiu total | $2,6 mil M | $3,6 mil M | $3,9 mil M | $4,8 mil M | $4,9 mil M | $5,9 mil M | $5,8 mil M | $5,7 mil M | $5,7 mil M | $5,6 mil M |
| Patrimoni net | −$1,9 mil M | −$2,7 mil M | −$3,0 mil M | −$3,4 mil M | −$3,3 mil M | −$4,2 mil M | −$4,2 mil M | −$4,1 mil M | −$4,0 mil M | −$3,9 mil M |
| Marges | ||||||||||
| Marge brut | 31,1% | 31,1% | 38,0% | 38,8% | 38,7% | 38,7% | 36,3% | 38,6% | 39,3% | 40,0% |
| Marge operatiu | 18,4% | 18,7% | 16,7% | 17,4% | 17,6% | 17,9% | 16,9% | 18,3% | 18,7% | 19,3% |
| Marge EBITDA | 19,9% | 20,3% | 18,2% | 19,1% | 19,2% | 19,6% | 18,7% | 20,1% | 20,5% | 21,1% |
| Marge net | 8,7% | 10,0% | 10,5% | 11,1% | 11,9% | 11,7% | 10,0% | 11,6% | 12,4% | 12,2% |
| Marge FCL | 9,5% | 9,0% | 8,0% | 11,4% | 12,2% | 12,9% | 8,6% | 10,8% | 10,9% | 13,6% |
| Rendibilitat | ||||||||||
| Rendibilitat del capital | 99,4% | 112,3% | 113,7% | 107,3% | 110,9% | 93,5% | 81,6% | 82,6% | 87,1% | 92,2% |
| Rendibilitat del capital emprat | 123,3% | 138,8% | 118,4% | 86,5% | 71,7% | 71,7% | 71,6% | 74,7% | 140,4% | 146,8% |
| Rendibilitat sobre actius | 28,3% | 35,8% | 41,5% | 35,0% | 33,3% | 31,5% | 27,6% | 31,7% | 34,2% | 34,9% |
| Creixement | ||||||||||
| Creixement dels ingressos | 11,6% | 12,8% | 23,1% | 5,4% | 13,8% | 5,8% | 4,1% | −1,3% | 5,1% | 5,0% |
| Creixement del benefici net | 11,4% | 29,5% | 30,3% | 10,7% | 22,6% | 3,9% | −11,4% | 14,8% | 12,5% | 3,0% |
| Creixement del BPA | 23,9% | 35,6% | 43,2% | 14,5% | 29,6% | 9,3% | −7,5% | 17,0% | 13,9% | 5,3% |
| Creixement del FCL | 2,4% | 7,4% | 9,2% | 50,0% | 22,5% | 11,1% | −30,7% | 25,1% | 5,5% | 31,2% |
| Variació del nombre d'accions | −10,1% | −4,5% | −9,1% | −3,3% | −5,4% | −4,9% | −4,2% | −1,9% | −1,2% | −2,2% |
| Salut financera | ||||||||||
| Deute net / EBITDA | 4,4x | 5,5x | 5,6x | 5,7x | 5,0x | 5,8x | 5,9x | 5,4x | 5,0x | 4,5x |
| Cobertura d'interessos | 4,1x | 4,3x | 3,9x | 4,2x | 4,2x | 4,1x | 3,9x | 4,2x | 4,5x | 4,9x |
| Ràtio de liquiditat | 1,2x | 1,5x | 1,5x | 1,7x | 1,9x | 1,5x | 1,5x | 1,5x | 0,6x | 1,7x |
| Prova àcida | 1,1x | 1,4x | 1,4x | 1,6x | 1,7x | 1,3x | 1,3x | 1,3x | 0,5x | 1,5x |
| Assignació de capital | ||||||||||
| Capex / ingressos | 2,4% | 3,2% | 3,5% | 2,4% | 2,2% | 2,2% | 1,9% | 2,4% | 2,4% | 2,4% |
| Remun. en accions / ingressos | 0,8% | 0,7% | 0,7% | 0,6% | 0,6% | 0,7% | 0,6% | 0,8% | 0,9% | 0,9% |
| Remuneració / FCL | 160,0% | 457,1% | 249,2% | 195,6% | 84,6% | 260,8% | 116,3% | 90,4% | 105,4% | 88,5% |
| Indicadors de qualitat | ||||||||||
| F-score de Piotroski | 6,0 | 8,0 | 9,0 | 8,0 | 6,0 | 5,0 | 6,0 | 9,0 | 8,0 | 8,0 |
| Z'' d'Altman | −4,2 | −5,9 | −6,1 | −4,2 | −2,8 | −4,8 | −5,0 | −4,3 | −7,4 | −3,1 |
| Ràtio de meritacions | −10,3% | −8,2% | −3,7% | −8,4% | −6,9% | −8,9% | −1,4% | −4,4% | −2,4% | −11,0% |
Font: informes SEC EDGAR XBRL (CIK 0001286681). Dades actualitzades el 13 d'octubre de 2026. Els quarts trimestres són l'any sencer menys els nou primers mesos. Només a títol informatiu: no és assessorament d'inversió. Comprova els informes originals abans de fiar-te d'una xifra.