



Kwartaalcijfers
· DAL
DAL NYSE Passenger Airlines Financiële sector BJ2016–BJ2025
Delta Air Lines' revenue rose 2.8% to $63.4 billion in fiscal 2025. Its operating margin was 9.2%, down from 9.7% a year earlier. Free cash flow was $3.8 billion, up 33.2%. It paid out $440 million in dividends and buybacks, 11% of free cash flow. The diluted share count rose 0.9%.
Laatste slotkoers · 23 okt. 2026
$76,78
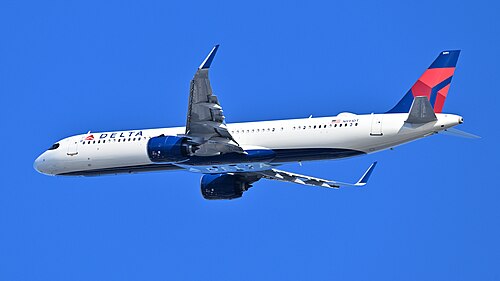
3,1%Delta Air Lines flies passengers and cargo across the United States and to six continents. Its main hubs are Atlanta, Detroit, Minneapolis-St. Paul and Salt Lake City, with coastal hubs in Boston, Los Angeles, New York and Seattle. Delta says it carried over 200 million customers in 2025, using a fleet of 1,314 aircraft at year end. Regional airlines, including its own Endeavor Air, fly smaller planes under the Delta Connection name.
Most of its money comes from ticket sales, and Delta is putting more seats in its pricier cabins, such as Delta One and First Class. Its SkyMiles loyalty program is a large second source: Delta sells miles to partners, above all American Express, whose co-branded credit card brought in $8.2 billion in 2025. It also earns money from cargo, from repairing engines and aircraft for other airlines through Delta TechOps, and from Delta Vacations. Delta says the airline industry is highly competitive.
Abroad, Delta works through joint ventures with Air France-KLM, Virgin Atlantic, Aeromexico, LATAM and Korean Air, and owns stakes in several of these carriers. It also owns Monroe Energy, which runs an oil refinery near Philadelphia that supplies jet fuel to its northeastern operations. Delta has more than 100,000 employees.
Delta Air Lines had in boekjaar 2025 een omzet van $63,4 mld, 2,8% meer dan een jaar eerder.
Van boekjaar 2016 tot 2025 groeide de verwaterde winst per aandeel 3,6% per jaar. Verliesperiodes staan in het rood.
Bedrijfsresultaat na belasting als deel van het geld dat in het bedrijf is geïnvesteerd: schuld plus eigen vermogen, min kas.
De vrije kasstroom was $3,8 mld in boekjaar 2025, 6,1% van de omzet. Operationele kasstroom min investeringen.
Delta Air Lines keerde in boekjaar 2025 $440 mln uit aan aandeelhouders, 11% van de vrije kasstroom. Het aantal verwaterde aandelen steeg 0,9%.
Wijzig de aannames en zie wat ze per aandeel betekenen. Dit zijn modellen, geen voorspellingen of koersdoelen: de uitkomst hangt volledig af van wat je invoert.
Waarde per aandeel
—
Telt een netto kaspositie van −$9,8 mld op en deelt door 654,0 mln verwaterde aandelen. Tien jaar kasstromen plus een eindwaarde, verdisconteerd naar vandaag.
Waarde per aandeel
—
Referentiemultiples: vandaag 15,3x · branchegenoten 11,4x · sector 26,0x.
Kas, schuld en de ratio's die laten zien hoe makkelijk Delta Air Lines die kan dragen.
| Einde boekjaar | BJ21 | BJ22 | BJ23 | BJ24 | BJ25 |
|---|---|---|---|---|---|
| Kas en kortlopende beleggingen | $11,3 mld | $6,5 mld | $3,9 mld | $3,1 mld | $4,3 mld |
| Schuld incl. financiële lease | $26,9 mld | $23,0 mld | $20,1 mld | $16,2 mld | $14,1 mld |
| Nettoschuld / EBITDA | 4,0x | 2,9x | 2,1x | 1,5x | 1,2x |
| Schuld / eigen vermogen | 6,9x | 3,5x | 1,8x | 1,1x | 0,7x |
| Rentedekking | 1,2x | 2,9x | 4,7x | 6,0x | 6,9x |
| Current ratio | 0,8x | 0,5x | 0,4x | 0,4x | 0,4x |
| Quick ratio | 0,8x | 0,5x | 0,4x | 0,4x | 0,4x |
| Totaal activa | $72,5 mld | $72,3 mld | $73,6 mld | $75,4 mld | $81,3 mld |
| Totaal verplichtingen | $68,6 mld | $65,7 mld | $62,5 mld | $60,1 mld | $60,5 mld |
| Eigen vermogen | $3,9 mld | $6,6 mld | $11,1 mld | $15,3 mld | $20,9 mld |
| Nettoschuld (− = netto kas) | $15,6 mld | $16,5 mld | $16,2 mld | $13,1 mld | $9,8 mld |
Aankopen en verkopen op de open markt door bestuurders, commissarissen en eigenaren van meer dan 10%, uit Form 4-meldingen. „Plan” markeert transacties onder een vooraf opgesteld Rule 10b5-1-plan.
Gekocht, 12 maanden
$0,0 mln
0 insiders
Verkocht, 12 maanden
$38,5 mln
7 insiders
Van de verkopen via plannen
0%
$0,0 mln
| Datum | Insider | Transactie | Aandelen | Koers | Waarde | Rapport |
|---|---|---|---|---|---|---|
| 5 aug. 2026 | Michael P HuertaDirector | Verkocht | 3.100 | $94,12 | $0,3 mln | Form 4 |
| 5 aug. 2026 | Steven M SearEVP - Global Sales & Distrib | Verkocht | 40.460 | $93,55 | $3,8 mln | Form 4 |
| 4 aug. 2026 | Alain BellemareEVP & Pres. - International | Verkocht | 35.000 | $92,72 | $3,2 mln | Form 4 |
| 4 aug. 2026 | Edward H BastianChief Executive Officer, Director | Verkocht | 206.510 | $92,80 | $19,2 mln | Form 4 |
| 4 aug. 2026 | Peter W CarterPresident | Verkocht | 39.900 | $92,98 | $3,7 mln | Form 4 |
| 3 aug. 2026 | David G DewaltDirector | Verkocht | 31.756 | $90,85 | $2,9 mln | Form 4 |
| 27 mei 2026 | Alain BellemareEVP & Pres. - International | Verkocht | 25.000 | $81,44 | $2,0 mln | Form 4 |
| 27 mei 2026 | Allison C AusbandEVP & Chief People Officer | Verkocht | 5.000 | $80,90 | $0,4 mln | Form 4 |
| 26 mei 2026 | Allison C AusbandEVP & Chief People Officer | Verkocht | 5.000 | $79,00 | $0,4 mln | Form 4 |
| 22 mei 2026 | Allison C AusbandEVP & Chief People Officer | Verkocht | 9.710 | $76,00 | $0,7 mln | Form 4 |
| 21 mei 2026 | Allison C AusbandEVP & Chief People Officer | Verkocht | 5.000 | $73,50 | $0,4 mln | Form 4 |
| 7 mei 2026 | Alain BellemareEVP & Pres. - International | Verkocht | 20.621 | $72,75 | $1,5 mln | Form 4 |
Negen geslaagd/niet-geslaagd-tests van winstgevendheid, financiering en efficiëntie. 8–9 is sterk, 0–2 zwak.
| Test | BJ23 | BJ24 | BJ25 |
|---|---|---|---|
| Nettowinst is positief | ✓ | ✓ | ✓ |
| Operationele kasstroom is positief | ✓ | ✓ | ✓ |
| Rendement op activa steeg | ✓ | ✕ | ✓ |
| Operationele kasstroom hoger dan nettowinst | ✓ | ✓ | ✓ |
| Schuld daalde ten opzichte van activa | ✓ | ✓ | ✓ |
| Current ratio steeg | ✕ | ✕ | ✓ |
| Aantal aandelen steeg niet | ✕ | ✕ | ✕ |
| Brutomarge steeg | — | — | — |
| Omzet steeg ten opzichte van activa | ✓ | ✓ | ✓ |
| F-score | 6 / 8 | 5 / 8 | 7 / 8 |
| Accrualsratio | −2,5% | −6,1% | −4,3% |
| Altman Z'' | −0,50 | −0,28 | 0,03 |
Laatste boekjaar van elk bedrijf. Boekjaren eindigen in verschillende maanden, dus de periodes vallen niet precies samen.
| Bedrijf | Beurswaarde | Groei | Oper. marge | FCF-marge | ROIC | K/W | F-score | |
|---|---|---|---|---|---|---|---|---|
| Delta Air Lines DAL | $50,6 mld | 2,8% | 9,2% | 6,1% | 16,0% | 15,3x | 7 | |
| United Airlines UAL | $32,1 mld | 3,5% | 8,0% | 4,3% | 15,3% | 9,0x | 6 | Vergelijken → |
| Carnival CCL | $35,7 mld | 6,4% | 16,8% | 9,8% | 12,1% | 11,4x | 7 | Vergelijken → |
| FedEx FDX | $71,4 mld | 7,7% | 5,8% | 5,4% | 9,4% | — | 7 | Vergelijken → |
Bedragen in USD. Beweeg over de naam van een ratio voor de definitie.
| Boekjaar | BJ16 | BJ17 | BJ18 | BJ19 | BJ20 | BJ21 | BJ22 | BJ23 | BJ24 | BJ25 |
|---|---|---|---|---|---|---|---|---|---|---|
| Winst-en-verliesrekening | ||||||||||
| Omzet | $39,6 mld | $41,2 mld | $44,4 mld | $47,0 mld | $17,1 mld | $29,9 mld | $50,6 mld | $58,0 mld | $61,6 mld | $63,4 mld |
| Bedrijfsresultaat | $7,0 mld | $6,0 mld | $5,3 mld | $6,6 mld | −$12,5 mld | $1,9 mld | $3,7 mld | $5,5 mld | $6,0 mld | $5,8 mld |
| Rentelasten | $388 mln | $396 mln | $376 mln | $481 mln | $761 mln | $1,5 mld | $1,3 mld | $1,2 mld | $1,0 mld | $850 mln |
| Winst voor belasting | $6,4 mld | $5,5 mld | $5,2 mld | $6,2 mld | −$15,6 mld | $398 mln | $1,9 mld | $5,6 mld | $4,7 mld | $6,2 mld |
| Winstbelasting | $2,2 mld | $2,3 mld | $1,2 mld | $1,4 mld | −$3,2 mld | $118 mln | $596 mln | $999 mln | $1,2 mld | $1,2 mld |
| Nettowinst | $4,2 mld | $3,2 mld | $3,9 mld | $4,8 mld | −$12,4 mld | $280 mln | $1,3 mld | $4,6 mld | $3,5 mld | $5,0 mld |
| Verwaterde winst per aandeel | $5,55 | $4,43 | $5,67 | $7,30 | −$19,49 | $0,44 | $2,06 | $7,17 | $5,33 | $7,66 |
| Verwaterde aandelen | 0,76 mld | 0,72 mld | 0,69 mld | 0,65 mld | 0,64 mld | 0,64 mld | 0,64 mld | 0,64 mld | 0,65 mld | 0,65 mld |
| Kasstroom | ||||||||||
| Operationele kasstroom | $7,2 mld | $5,0 mld | $7,0 mld | $8,4 mld | −$3,8 mld | $3,3 mld | $6,4 mld | $6,5 mld | $8,0 mld | $8,3 mld |
| Investeringen (capex) | $3,4 mld | $3,9 mld | $5,2 mld | $4,9 mld | $1,9 mld | $3,2 mld | $6,4 mld | $5,3 mld | $5,1 mld | $4,5 mld |
| Vrije kasstroom | $3,8 mld | $1,1 mld | $1,8 mld | $3,5 mld | −$5,7 mld | $17,0 mln | −$3,0 mln | $1,1 mld | $2,9 mld | $3,8 mld |
| Afschrijvingen | $1,9 mld | $2,2 mld | $2,3 mld | $2,6 mld | $2,3 mld | $2,0 mld | $2,1 mld | $2,3 mld | $2,5 mld | $2,4 mld |
| Beloning in aandelen | $154 mln | $169 mln | $159 mln | $161 mln | $119 mln | $149 mln | $150 mln | $180 mln | $236 mln | $313 mln |
| Overnames | $0,0 mln | $0,0 mln | $0,0 mln | $0,0 mln | $0,0 mln | $0,0 mln | $0,0 mln | $0,0 mln | $0,0 mln | $0,0 mln |
| Inkoop eigen aandelen | $2,6 mld | $1,7 mld | $1,6 mld | $2,0 mld | $344 mln | $0,0 mln | $0,0 mln | $0,0 mln | $0,0 mln | $0,0 mln |
| Betaald dividend | $509 mln | $731 mln | $909 mln | $980 mln | $260 mln | $0,0 mln | $0,0 mln | $128 mln | $321 mln | $440 mln |
| Dividend en inkoop | $3,1 mld | $2,4 mld | $2,5 mld | $3,0 mld | $604 mln | $0,0 mln | $0,0 mln | $128 mln | $321 mln | $440 mln |
| Balans | ||||||||||
| Kas en kortlopende beleggingen | $3,2 mld | $2,6 mld | $1,8 mld | $2,9 mld | $14,1 mld | $11,3 mld | $6,5 mld | $3,9 mld | $3,1 mld | $4,3 mld |
| Totale schuld | $7,0 mld | $8,4 mld | $9,4 mld | $10,1 mld | $28,0 mld | $25,1 mld | $21,4 mld | $18,6 mld | $15,3 mld | $13,3 mld |
| Verplichtingen uit financiële lease | $0,0 mln | $0,0 mln | $403 mln | $1,1 mld | $1,2 mld | $1,8 mld | $1,6 mld | $1,4 mld | $847 mln | $805 mln |
| Vlottende activa | $7,5 mld | $7,8 mld | $6,3 mld | $8,2 mld | $17,4 mld | $15,9 mld | $13,0 mld | $10,3 mld | $9,8 mld | $11,0 mld |
| Kortlopende schulden | $15,2 mld | $19,0 mld | $18,6 mld | $20,2 mld | $15,9 mld | $21,0 mld | $25,9 mld | $26,4 mld | $26,7 mld | $27,6 mld |
| Voorraden | $519 mln | $916 mln | $592 mln | $0,0 mln | $0,0 mln | $0,0 mln | $0,0 mln | $0,0 mln | $0,0 mln | $0,0 mln |
| Materiële vaste activa, netto | $24,4 mld | $26,6 mld | $28,3 mld | $31,3 mld | $26,5 mld | $28,7 mld | $33,1 mld | $35,5 mld | $37,6 mld | $39,7 mld |
| Totaal activa | $51,9 mld | $53,7 mld | $60,3 mld | $64,5 mld | $72,0 mld | $72,5 mld | $72,3 mld | $73,6 mld | $75,4 mld | $81,3 mld |
| Totaal verplichtingen | $40,0 mld | $41,1 mld | $46,6 mld | $49,2 mld | $70,5 mld | $68,6 mld | $65,7 mld | $62,5 mld | $60,1 mld | $60,5 mld |
| Eigen vermogen | $11,3 mld | $12,5 mld | $13,7 mld | $15,4 mld | $1,5 mld | $3,9 mld | $6,6 mld | $11,1 mld | $15,3 mld | $20,9 mld |
| Marges | ||||||||||
| Operationele marge | 17,7% | 14,5% | 11,9% | 14,1% | −72,9% | 6,3% | 7,2% | 9,5% | 9,7% | 9,2% |
| EBITDA-marge | 22,4% | 19,9% | 17,1% | 19,6% | −59,4% | 13,0% | 11,4% | 13,5% | 13,8% | 13,0% |
| Nettomarge | 10,6% | 7,8% | 8,9% | 10,1% | −72,5% | 0,9% | 2,6% | 7,9% | 5,6% | 7,9% |
| FCF-marge | 9,7% | 2,7% | 4,2% | 7,4% | −33,3% | 0,1% | −0,0% | 2,0% | 4,7% | 6,1% |
| Rendement | ||||||||||
| Rendement op kapitaal | — | 20,8% | 20,1% | 22,5% | −49,0% | 7,4% | 11,9% | 18,0% | 16,0% | 16,0% |
| Rendement op geïnvesteerd vermogen | 19,4% | 16,7% | 13,8% | 15,4% | −24,8% | 3,5% | 7,5% | 11,8% | 12,5% | 11,4% |
| Rendement op eigen vermogen | 37,9% | 26,9% | 30,0% | 32,8% | −146,6% | — | 25,2% | 52,1% | 26,2% | 27,7% |
| Rendement op activa | 8,0% | 6,1% | 6,9% | 7,6% | −18,1% | 0,4% | 1,8% | 6,3% | 4,6% | 6,4% |
| Groei | ||||||||||
| Omzetgroei | −2,6% | 4,1% | 7,7% | 5,8% | −63,6% | 74,9% | 69,2% | 14,8% | 6,2% | 2,8% |
| Groei nettowinst | −7,3% | −23,6% | 22,8% | 21,1% | −359,8% | — | 370,7% | 249,7% | −25,0% | 44,8% |
| Groei winst per aandeel | −1,4% | −20,2% | 28,0% | 28,8% | −367,0% | — | 368,2% | 248,1% | −25,7% | 43,7% |
| FCF-groei | −23,2% | −70,4% | 63,1% | 89,0% | −263,1% | — | −117,7% | — | 152,9% | 33,2% |
| Verandering aantal aandelen | −6,1% | −4,2% | −4,0% | −5,9% | −2,6% | 0,8% | 0,0% | 0,3% | 0,8% | 0,9% |
| Financiële gezondheid | ||||||||||
| Nettoschuld / EBITDA | 0,4x | 0,7x | 1,1x | 0,9x | — | 4,0x | 2,9x | 2,1x | 1,5x | 1,2x |
| Schuld / eigen vermogen | 0,6x | 0,7x | 0,7x | 0,7x | — | 6,9x | 3,5x | 1,8x | 1,1x | 0,7x |
| Rentedekking | 18,0x | 15,1x | 14,0x | 13,8x | −16,4x | 1,2x | 2,9x | 4,7x | 6,0x | 6,9x |
| Current ratio | 0,5x | 0,4x | 0,3x | 0,4x | 1,1x | 0,8x | 0,5x | 0,4x | 0,4x | 0,4x |
| Quick ratio | 0,5x | 0,4x | 0,3x | 0,4x | 1,1x | 0,8x | 0,5x | 0,4x | 0,4x | 0,4x |
| Kapitaalallocatie | ||||||||||
| Capex / omzet | 8,6% | 9,4% | 11,6% | 10,5% | 11,1% | 10,9% | 12,6% | 9,2% | 8,3% | 7,1% |
| Aandelenbeloning / omzet | 0,4% | 0,4% | 0,4% | 0,3% | 0,7% | 0,5% | 0,3% | 0,3% | 0,4% | 0,5% |
| Uitkeringen / FCF | 81,3% | 212,7% | 134,6% | 86,2% | — | 0,0% | — | 11,2% | 11,1% | 11,5% |
| Kwaliteitsscores | ||||||||||
| Piotroski F-score | — | 5,0 | 6,0 | 7,0 | 3,0 | 6,0 | 7,0 | 6,0 | 5,0 | 7,0 |
| Altman Z'' | 0,7 | 0,2 | 0,1 | 0,4 | −1,0 | −0,2 | −0,7 | −0,5 | −0,3 | 0,0 |
| Accrualsratio | −5,8% | −3,5% | −5,4% | −5,9% | −12,6% | −4,1% | −7,0% | −2,5% | −6,1% | −4,3% |
Bron: SEC EDGAR XBRL-rapporten (CIK 0000027904). Gegevens bijgewerkt op 9 oktober 2026. Vierde kwartalen zijn het hele jaar min de eerste negen maanden. Uitsluitend ter informatie: geen beleggingsadvies. Controleer de oorspronkelijke rapporten voordat je op een cijfer vertrouwt.