


Wyniki kwartalne
· UAL
UAL Nasdaq Passenger Airlines Finanse RO2016–RO2025
United Airlines' revenue rose 3.5% to $59.1 billion in fiscal 2025. Its operating margin was 8.0%, down from 8.9% a year earlier. Free cash flow was $2.6 billion, down 33.2%. It paid out $637 million in dividends and buybacks, 25% of free cash flow. The diluted share count fell 1.4%.
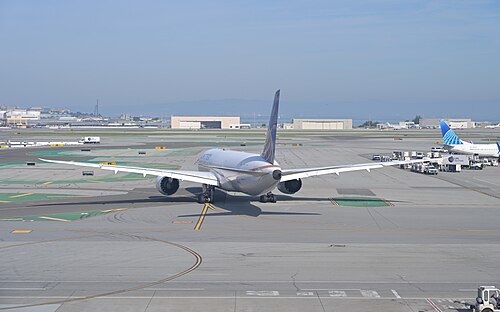
United Airlines flies passengers and cargo across North America and to Asia, Europe, Africa, the Pacific, the Middle East and Latin America. Its hubs are Chicago O'Hare, Denver, Houston, Los Angeles, Newark, San Francisco, Washington Dulles and Guam. Smaller regional airlines, such as SkyWest and Republic, fly shorter routes under the United Express name on contract, which lets United serve smaller cities that feed its hubs.
Nearly all of the parent company's revenue comes from the airline. Besides ticket sales, United earns money from carrying freight and mail and from its MileagePlus loyalty program, which sells miles to partners such as Chase, the issuer of its co-branded credit card. Members used about 10.9 million MileagePlus flight awards in 2025. United also sells maintenance, ground handling and flight training to other companies. It competes with other US airlines, which can push it to match discounted fares, and with foreign carriers on international routes.
United belongs to the Star Alliance and runs joint businesses with Air Canada, Lufthansa, ANA and Air New Zealand that share routes and revenue. It had about 113,200 employees at the end of 2025, roughly 83% of them represented by unions.
United Airlines osiągnęła $59,1 mld przychodów w RO 2025, o 3,5% więcej niż rok wcześniej.
Od roku obrotowego 2016 do 2025 rozwodniony EPS rósł o 4,7% rocznie. Okresy ze stratą pokazano na czerwono.
Zysk operacyjny po opodatkowaniu w relacji do kapitału zainwestowanego w firmę: dług plus kapitał własny minus gotówka.
Wolne przepływy pieniężne wyniosły $2,6 mld w RO 2025, czyli 4,3% przychodów. Przepływy operacyjne minus nakłady inwestycyjne.
United Airlines przekazała akcjonariuszom $637 mln w RO 2025, czyli 25% wolnych przepływów pieniężnych. Liczba rozwodnionych akcji spadła o 1,4%.
Zmień założenia i zobacz, co oznaczają na akcję. To modele, a nie prognozy ani ceny docelowe: wynik zależy wyłącznie od tego, co wpiszesz.
Wartość na akcję
—
Dodaje gotówkę netto −$9,5 mld i dzieli przez 328,5 mln rozwodnionych akcji. Dziesięć lat przepływów pieniężnych plus wartość rezydualna, zdyskontowane na dziś.
Wartość na akcję
—
Mnożniki odniesienia: dziś 9,0x · konkurenci 13,4x · sektor 26,0x.
Gotówka, dług i wskaźniki, które pokazują, jak łatwo United Airlines może go udźwignąć.
| Koniec roku obrotowego | RO21 | RO22 | RO23 | RO24 | RO25 |
|---|---|---|---|---|---|
| Gotówka i inwestycje krótkoterminowe | $18,4 mld | $16,4 mld | $14,4 mld | $14,5 mld | $12,2 mld |
| Dług z leasingiem finansowym | $33,7 mld | $31,4 mld | $29,3 mld | $24,9 mld | $21,7 mld |
| Dług netto / EBITDA | 10,4x | 3,1x | 2,2x | 1,3x | 1,2x |
| Dług / kapitał własny | 6,7x | 4,6x | 3,2x | 2,0x | 1,4x |
| Pokrycie odsetek | −0,7x | 1,3x | 2,2x | 3,1x | 3,4x |
| Wskaźnik płynności bieżącej | 1,2x | 1,0x | 0,8x | 0,8x | 0,7x |
| Wskaźnik szybki | 1,2x | 1,0x | 0,8x | 0,8x | 0,7x |
| Aktywa ogółem | $68,2 mld | $67,4 mld | $71,1 mld | $74,1 mld | $76,4 mld |
| Zobowiązania ogółem | $63,1 mld | $60,5 mld | $61,8 mld | $61,4 mld | $61,2 mld |
| Kapitał własny | $5,0 mld | $6,9 mld | $9,3 mld | $12,7 mld | $15,3 mld |
| Dług netto (− = gotówka netto) | $15,3 mld | $15,0 mld | $15,0 mld | $10,5 mld | $9,5 mld |
Zakupy i sprzedaże na rynku dokonane przez członków zarządu, dyrektorów i właścicieli ponad 10%, z formularzy Form 4. „Plan” oznacza transakcje w ramach z góry ustalonego planu Rule 10b5-1.
Kupno, 12 miesięcy
$0,0 mln
0 insiderów
Sprzedaż, 12 miesięcy
$40,5 mln
6 insiderów
Sprzedaży w ramach planów
18%
$7,3 mln
| Data | Insider | Transakcja | Akcje | Kurs | Wartość | Raport |
|---|---|---|---|---|---|---|
| 25 sie 2026 | Andrew P NocellaEVP & Chief Commercial Officer | Sprzedaż | 5 000 | $117,00 | $0,6 mln | Form 4 |
| 4 sie 2026 | Andrew P NocellaEVP & Chief Commercial Officer | Sprzedaż | 3 000 | $132,30 | $0,4 mln | Form 4 |
| 3 sie 2026 | Michael D. LeskinenEVP & Chief Financial Officer | Sprzedaż plan | 10 000 | $128,19 | $1,3 mln | Form 4 |
| 28 lip 2026 | Andrew P NocellaEVP & Chief Commercial Officer | Sprzedaż | 4 200 | $120,48 | $0,5 mln | Form 4 |
| 28 lip 2026 | Brett J HartPresident | Sprzedaż | 30 108 | $120,72 | $3,6 mln | Form 4 |
| 24 lip 2026 | Torbjorn J EnqvistEVP & Chief Operations Officer | Sprzedaż | 20 000 | $119,91 | $2,4 mln | Form 4 |
| 21 lip 2026 | Kirby J ScottChief Executive Officer, Director | Sprzedaż | 159 321 | $118,05 | $18,8 mln | Form 4 |
| 16 cze 2026 | Kirby J ScottChief Executive Officer, Director | Sprzedaż plan | 1 078 | $120,74 | $0,1 mln | Form 4 |
| 15 cze 2026 | Kirby J ScottChief Executive Officer, Director | Sprzedaż plan | 48 303 | $121,30 | $5,9 mln | Form 4 |
| 26 maj 2026 | Kate GeboEVP HR and Labor Relations | Sprzedaż | 40 000 | $105,42 | $4,2 mln | Form 4 |
| 1 maj 2026 | Andrew P NocellaEVP & Chief Commercial Officer | Sprzedaż | 7 000 | $90,19 | $0,6 mln | Form 4 |
| 2 lut 2026 | Brett J HartPresident | Sprzedaż | 19 000 | $106,45 | $2,0 mln | Form 4 |
Dziewięć testów zaliczony/niezaliczony z rentowności, finansowania i efektywności. 8–9 to wynik mocny, 0–2 słaby.
| Test | RO23 | RO24 | RO25 |
|---|---|---|---|
| Zysk netto jest dodatni | ✓ | ✓ | ✓ |
| Przepływy operacyjne są dodatnie | ✓ | ✓ | ✓ |
| Wzrosła rentowność aktywów | ✓ | ✓ | ✓ |
| Przepływy operacyjne przewyższają zysk netto | ✓ | ✓ | ✓ |
| Dług spadł w relacji do aktywów | ✓ | ✓ | ✓ |
| Wzrosła płynność bieżąca | ✕ | ✕ | ✕ |
| Liczba akcji nie wzrosła | ✕ | ✕ | ✓ |
| Wzrosła marża brutto | — | — | — |
| Przychody wzrosły w relacji do aktywów | ✓ | ✓ | ✕ |
| F-score | 6 / 8 | 6 / 8 | 6 / 8 |
| Wskaźnik memoriałowy | −6,2% | −8,7% | −6,8% |
| Altman Z'' | 0,39 | 0,59 | 0,31 |
Ostatni rok obrotowy każdej firmy. Lata obrotowe kończą się w różnych miesiącach, więc okresy nie pokrywają się dokładnie.
| Firma | Kapitalizacja | Wzrost | Marża op. | Marża FCF | ROIC | C/Z | F-score | |
|---|---|---|---|---|---|---|---|---|
| United Airlines UAL | $32,1 mld | 3,5% | 8,0% | 4,3% | 15,3% | 9,0x | 6 | |
| Delta Air Lines DAL | $50,6 mld | 2,8% | 9,2% | 6,1% | 16,0% | 15,3x | 7 | Porównaj → |
| Carnival CCL | $35,7 mld | 6,4% | 16,8% | 9,8% | 12,1% | 11,4x | 7 | Porównaj → |
Kwoty w USD. Najedź na nazwę wskaźnika, aby zobaczyć definicję.
| Rok obrotowy | RO16 | RO17 | RO18 | RO19 | RO20 | RO21 | RO22 | RO23 | RO24 | RO25 |
|---|---|---|---|---|---|---|---|---|---|---|
| Rachunek zysków i strat | ||||||||||
| Przychody | $36,6 mld | $37,7 mld | $41,3 mld | $43,3 mld | $15,4 mld | $24,6 mld | $45,0 mld | $53,7 mld | $57,1 mld | $59,1 mld |
| Zysk operacyjny | $4,3 mld | $3,6 mld | $3,2 mld | $4,3 mld | −$6,4 mld | −$1,0 mld | $2,3 mld | $4,2 mld | $5,1 mld | $4,7 mld |
| Koszty odsetek | $674 mln | $626 mln | $670 mln | $648 mln | $874 mln | $1,4 mld | $1,8 mld | $2,0 mld | $1,6 mld | $1,4 mld |
| Zysk przed opodatkowaniem | $3,8 mld | $3,0 mld | $2,6 mld | $3,9 mld | −$8,8 mld | −$2,6 mld | $990 mln | $3,4 mld | $4,2 mld | $4,3 mld |
| Podatek dochodowy | $1,5 mld | $880 mln | $526 mln | $905 mln | −$1,8 mld | −$593 mln | $253 mln | $769 mln | $1,0 mld | $953 mln |
| Zysk netto | $2,2 mld | $2,1 mld | $2,1 mld | $3,0 mld | −$7,1 mld | −$2,0 mld | $737 mln | $2,6 mld | $3,1 mld | $3,4 mld |
| Rozwodniony EPS | $6,76 | $7,06 | $7,67 | $11,58 | −$25,30 | −$6,10 | $2,23 | $7,89 | $9,45 | $10,20 |
| Akcje rozwodnione | 0,33 mld | 0,30 mld | 0,28 mld | 0,26 mld | 0,28 mld | 0,32 mld | 0,33 mld | 0,33 mld | 0,33 mld | 0,33 mld |
| Przepływy pieniężne | ||||||||||
| Przepływy operacyjne | $5,5 mld | $3,5 mld | $6,2 mld | $6,9 mld | −$4,1 mld | $2,1 mld | $6,1 mld | $6,9 mld | $9,4 mld | $8,4 mld |
| Nakłady inwestycyjne (capex) | $3,2 mld | $3,9 mld | $4,1 mld | $4,5 mld | $1,7 mld | $2,1 mld | $4,8 mld | $7,2 mld | $5,6 mld | $5,9 mld |
| Wolne przepływy pieniężne | $2,3 mld | −$396 mln | $2,1 mld | $2,4 mld | −$5,9 mld | −$40,0 mln | $1,2 mld | −$260 mln | $3,8 mld | $2,6 mld |
| Amortyzacja | $2,0 mld | $2,1 mld | $2,2 mld | $2,3 mld | $2,5 mld | $2,5 mld | $2,5 mld | $2,7 mld | $2,9 mld | $2,9 mld |
| Wynagrodzenie w akcjach | $70,0 mln | $73,0 mln | $101 mln | $100 mln | $108 mln | $238 mln | $89,0 mln | $80,0 mln | $142 mln | $148 mln |
| Przejęcia | $0,0 mln | $0,0 mln | $0,0 mln | $0,0 mln | $0,0 mln | $0,0 mln | $0,0 mln | $0,0 mln | $0,0 mln | $0,0 mln |
| Skup akcji własnych | $2,6 mld | $1,8 mld | $1,2 mld | $1,6 mld | $353 mln | $0,0 mln | $0,0 mln | $0,0 mln | $162 mln | $637 mln |
| Wypłacone dywidendy | $0,0 mln | $0,0 mln | $0,0 mln | $0,0 mln | $0,0 mln | $0,0 mln | $0,0 mln | $0,0 mln | $0,0 mln | $0,0 mln |
| Dywidendy i skup akcji | $2,6 mld | $1,8 mld | $1,2 mld | $1,6 mld | $353 mln | $0,0 mln | $0,0 mln | $0,0 mln | $162 mln | $637 mln |
| Bilans | ||||||||||
| Gotówka i inwestycje krótkoterminowe | $4,4 mld | $3,8 mld | $4,0 mld | $4,9 mld | $11,7 mld | $18,4 mld | $16,4 mld | $14,4 mld | $14,5 mld | $12,2 mld |
| Dług ogółem | $10,8 mld | $13,3 mld | $13,4 mld | $14,6 mld | $26,7 mld | $33,4 mld | $31,2 mld | $29,1 mld | $24,7 mld | $21,3 mld |
| Zobowiązania z leasingu finansowego | $0,0 mln | $0,0 mln | $347 mln | $266 mln | $406 mln | $295 mln | $219 mln | $263 mln | $291 mln | $474 mln |
| Aktywa obrotowe | $7,3 mld | $7,1 mld | $7,1 mld | $8,2 mld | $14,8 mld | $21,8 mld | $20,1 mld | $18,5 mld | $18,9 mld | $16,9 mld |
| Zobowiązania krótkoterminowe | $12,3 mld | $12,8 mld | $13,8 mld | $14,9 mld | $12,7 mld | $18,3 mld | $20,0 mld | $22,2 mld | $23,3 mld | $26,1 mld |
| Zapasy | $0,0 mln | $0,0 mln | $0,0 mln | $0,0 mln | $0,0 mln | $0,0 mln | $0,0 mln | $0,0 mln | $0,0 mln | $0,0 mln |
| Rzeczowe aktywa trwałe, netto | $23,3 mld | $26,2 mld | $27,4 mld | $30,2 mld | $31,5 mld | $32,1 mld | $34,4 mld | $39,8 mld | $42,9 mld | $46,1 mld |
| Aktywa ogółem | $40,1 mld | $42,3 mld | $49,0 mld | $52,6 mld | $59,5 mld | $68,2 mld | $67,4 mld | $71,1 mld | $74,1 mld | $76,4 mld |
| Zobowiązania ogółem | $31,6 mld | $33,6 mld | $39,0 mld | $41,1 mld | $53,6 mld | $63,1 mld | $60,5 mld | $61,8 mld | $61,4 mld | $61,2 mld |
| Kapitał własny | $8,6 mld | $8,8 mld | $10,0 mld | $11,5 mld | $6,0 mld | $5,0 mld | $6,9 mld | $9,3 mld | $12,7 mld | $15,3 mld |
| Marże | ||||||||||
| Marża operacyjna | 11,9% | 9,6% | 7,8% | 9,9% | −41,4% | −4,2% | 5,2% | 7,8% | 8,9% | 8,0% |
| Marża EBITDA | 17,3% | 15,1% | 13,1% | 15,2% | −25,2% | 5,9% | 10,7% | 12,8% | 14,1% | 13,0% |
| Marża netto | 6,1% | 5,7% | 5,1% | 7,0% | −46,0% | −8,0% | 1,6% | 4,9% | 5,5% | 5,7% |
| Marża FCF | 6,3% | −1,1% | 5,1% | 5,5% | −38,2% | −0,2% | 2,8% | −0,5% | 6,7% | 4,3% |
| Rentowność | ||||||||||
| Zwrot z kapitału | 17,4% | 15,5% | 13,6% | 16,0% | −23,5% | −3,9% | 8,3% | 14,1% | 16,2% | 15,3% |
| Zwrot z zaangażowanego kapitału | 15,4% | 12,6% | 10,0% | 11,8% | −15,1% | −2,1% | 4,8% | 8,8% | 10,2% | 9,3% |
| Rentowność kapitału własnego | 25,5% | 24,7% | 22,5% | 27,9% | −80,8% | −35,7% | 12,4% | 32,3% | 28,6% | 24,0% |
| Rentowność aktywów | 5,5% | 5,2% | 4,6% | 5,9% | −12,6% | −3,1% | 1,1% | 3,8% | 4,3% | 4,5% |
| Wzrost | ||||||||||
| Wzrost przychodów | −3,5% | 3,2% | 9,5% | 4,7% | −64,5% | 60,4% | 82,5% | 19,5% | 6,2% | 3,5% |
| Wzrost zysku netto | −69,6% | −4,1% | −1,0% | 41,8% | −334,9% | — | — | 255,2% | 20,3% | 6,5% |
| Wzrost EPS | −65,3% | 4,4% | 8,6% | 51,0% | −318,5% | — | — | 253,8% | 19,8% | 7,9% |
| Wzrost FCF | −28,5% | −117,1% | — | 13,7% | −346,1% | — | — | −120,9% | — | −33,2% |
| Zmiana liczby akcji | −12,4% | −8,1% | −8,9% | −6,1% | 7,5% | 15,2% | 2,6% | 0,6% | 0,4% | −1,4% |
| Kondycja finansowa | ||||||||||
| Dług netto / EBITDA | 1,0x | 1,7x | 1,8x | 1,5x | — | 10,4x | 3,1x | 2,2x | 1,3x | 1,2x |
| Dług / kapitał własny | 1,3x | 1,5x | 1,4x | 1,3x | 4,6x | 6,7x | 4,6x | 3,2x | 2,0x | 1,4x |
| Pokrycie odsetek | 6,5x | 5,8x | 4,8x | 6,6x | −7,3x | −0,7x | 1,3x | 2,2x | 3,1x | 3,4x |
| Wskaźnik płynności bieżącej | 0,6x | 0,6x | 0,5x | 0,6x | 1,2x | 1,2x | 1,0x | 0,8x | 0,8x | 0,7x |
| Wskaźnik szybki | 0,6x | 0,6x | 0,5x | 0,6x | 1,2x | 1,2x | 1,0x | 0,8x | 0,8x | 0,7x |
| Alokacja kapitału | ||||||||||
| Capex / przychody | 8,8% | 10,3% | 9,9% | 10,5% | 11,3% | 8,6% | 10,7% | 13,4% | 9,8% | 9,9% |
| Wynagr. w akcjach / przychody | 0,2% | 0,2% | 0,2% | 0,2% | 0,7% | 1,0% | 0,2% | 0,2% | 0,3% | 0,3% |
| Wypłaty / FCF | 112,7% | — | 59,0% | 69,1% | — | — | 0,0% | — | 4,2% | 24,9% |
| Wskaźniki jakości | ||||||||||
| F-score Piotroskiego | 5,0 | 5,0 | 6,0 | 7,0 | 2,0 | 5,0 | 6,0 | 6,0 | 6,0 | 6,0 |
| Altman Z'' | 0,5 | 0,3 | 0,3 | 0,6 | −0,2 | 0,4 | 0,4 | 0,4 | 0,6 | 0,3 |
| Wskaźnik memoriałowy | −8,2% | −3,2% | −8,9% | −7,7% | −5,2% | −6,3% | −7,9% | −6,2% | −8,7% | −6,8% |
Źródło: raporty SEC EDGAR XBRL (CIK 0000100517). Dane zaktualizowane 21 października 2026. Czwarte kwartały to cały rok minus pierwsze dziewięć miesięcy. Wyłącznie w celach informacyjnych: nie jest to porada inwestycyjna. Sprawdź oryginalne raporty, zanim zaufasz liczbie.