Annual results
· COST
COST Nasdaq Consumer Staples Merchandise Retail Financials FY2017–FY2026
Costco's revenue rose 10.1% to $303.2 billion in fiscal 2026. Its operating margin was 3.9%, up from 3.8% a year earlier. Free cash flow was $9.4 billion, up 19.7%. It paid out $3.3 billion in dividends and buybacks, 35% of free cash flow.
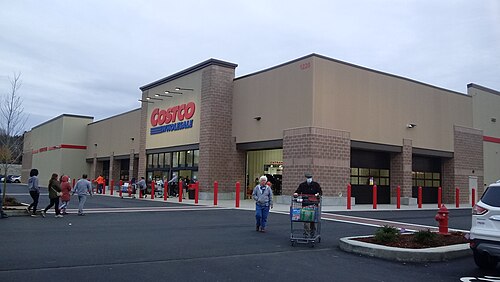
Costco runs membership warehouse stores that sell groceries, fresh food, household goods, electronics, appliances, clothing and more, along with gas stations, pharmacies, optical and hearing aid centers, and food courts. Shoppers must pay a yearly fee to join; in the United States the basic membership costs $65. It had 939 warehouses at the end of August 2026, in the United States and Puerto Rico, Canada, Mexico, Japan, the UK, Korea, Australia, Taiwan, China, New Zealand and several European countries. It also sells online in nine countries.
Costco keeps prices low by stocking fewer than 4,000 kinds of items per warehouse, buying in bulk and selling from plain, self-service buildings. It makes money on merchandise sales at thin margins and on membership fees, including from Executive members, who pay more and earn rewards on purchases. Its member renewal rate was 92.3% in the United States and Canada at the end of fiscal 2026. Gasoline made up 11% of net sales. It also sells its own Kirkland Signature brand.
Costco reports three segments by geography: the United States, Canada and other international. It names Walmart, Target, Kroger and Amazon among its significant competitors in the United States, along with other warehouse clubs such as Sam's Club and BJ's. It had 355,000 employees at the end of fiscal 2026.
Costco had $303.2B of revenue in fiscal 2026, up 10.1% on the year before.
From fiscal 2017 to 2026, diluted EPS grew 14.6% a year. Loss periods are shown in red.
After-tax operating income as a share of the money invested in the business: debt plus equity, minus cash.
Free cash flow was $9.4B in fiscal 2026, 3.1% of revenue. Cash from operations minus capital spending.
Costco returned $3.3B to shareholders in fiscal 2026, 35% of free cash flow. The diluted share count fell 0.1%.
Change the assumptions and see what they imply per share. These are models, not forecasts or price targets — the answer depends entirely on what you put in.
Value per share
—
Adds net cash of $13.7B and divides by 444.4M diluted shares. Ten years of cash flows plus a terminal value, discounted to today.
Value per share
—
Reference multiples: today 48.3x · peers 20.0x · sector 24.2x.
Cash, debt and the ratios that show how comfortably Costco can carry it.
| Fiscal year end | FY22 | FY23 | FY24 | FY25 | FY26 |
|---|---|---|---|---|---|
| Cash and short-term investments | $11.0B | $15.2B | $11.1B | $15.3B | $21.3B |
| Debt incl. finance leases | $6.6B | $6.5B | $7.4B | $7.3B | $7.6B |
| Net debt / EBITDA | −0.5x | −0.9x | −0.3x | −0.6x | −1.0x |
| Debt / equity | 0.3x | 0.3x | 0.3x | 0.3x | 0.2x |
| Interest coverage | 49.3x | 50.7x | 54.9x | 67.4x | 80.6x |
| Current ratio | 1.0x | 1.1x | 1.0x | 1.0x | 1.1x |
| Quick ratio | 0.5x | 0.6x | 0.4x | 0.6x | 0.6x |
| Total assets | $64.2B | $69.0B | $69.8B | $77.1B | $89.0B |
| Total liabilities | $43.5B | $43.9B | $46.2B | $47.9B | $53.2B |
| Shareholders' equity | $20.6B | $25.1B | $23.6B | $29.2B | $35.8B |
| Net debt (− = net cash) | −$4.4B | −$8.8B | −$3.7B | −$8.0B | −$13.7B |
Open-market purchases and sales by officers, directors and 10% owners, from Form 4 filings. 'Plan' marks trades under a pre-arranged Rule 10b5-1 plan.
Bought, 12 months
$0.0M
0 insiders
Sold, 12 months
$12.4M
9 insiders
Of sales under plans
0%
$0.0M
| Date | Insider | Trade | Shares | Price | Value | Filing |
|---|---|---|---|---|---|---|
| Oct 13, 2026 | William Richard WilcoxExecutive Vice President | Sold | 1,100 | $958.21 | $1.1M | Form 4 |
| Sep 29, 2026 | Caton FratesSr. Executive Vice President | Sold | 801 | $915.93 | $0.7M | Form 4 |
| Sep 29, 2026 | Claudine AdamoExecutive Vice President | Sold | 2,200 | $915.93 | $2.0M | Form 4 |
| Jun 23, 2026 | Kenneth D DenmanDirector | Sold | 885 | $957.45 | $0.8M | Form 4 |
| Apr 1, 2026 | Caton FratesExecutive Vice President | Sold | 700 | $993.00 | $0.7M | Form 4 |
| Mar 9, 2026 | Claudine AdamoExecutive Vice President | Sold | 730 | $1,003.02 | $0.7M | Form 4 |
| Jan 21, 2026 | Teresa A. JonesExecutive Vice President | Sold | 850 | $986.26 | $0.8M | Form 4 |
| Jan 16, 2026 | Susan L DeckerDirector | Sold | 458 | $955.00 | $0.4M | Form 4 |
| Jan 14, 2026 | James C KlauerExecutive Vice President | Sold | 1,500 | $939.00 | $1.4M | Form 4 |
| Jan 9, 2026 | Russell D MillerSr. Executive Vice President | Sold | 1,500 | $916.32 | $1.4M | Form 4 |
| Dec 30, 2025 | Javier PolitExecutive Vice President | Sold | 558 | $862.90 | $0.5M | Form 4 |
| Dec 29, 2025 | Javier PolitExecutive Vice President | Sold | 2,049 | $867.21 | $1.8M | Form 4 |
Nine pass/fail tests of profitability, funding and efficiency. 8–9 is strong, 0–2 weak.
| Test | FY24 | FY25 | FY26 |
|---|---|---|---|
| Net income is positive | ✓ | ✓ | ✓ |
| Cash from operations is positive | ✓ | ✓ | ✓ |
| Return on assets rose | ✓ | ✓ | ✓ |
| Cash from operations exceeds net income | ✓ | ✓ | ✓ |
| Debt fell relative to assets | ✓ | ✓ | ✓ |
| Current ratio rose | ✕ | ✓ | ✓ |
| Share count didn't rise | ✕ | ✕ | ✓ |
| Gross margin rose | ✓ | ✓ | ✕ |
| Revenue rose relative to assets | ✕ | ✓ | ✕ |
| F-score | 6 / 9 | 8 / 9 | 7 / 9 |
| Accruals ratio | −5.7% | −7.1% | −7.9% |
| Altman Z'' | 2.14 | 2.61 | 2.83 |
Each company's latest fiscal year. Fiscal years end in different months, so periods don't line up exactly.
| Company | Market cap | Growth | Op. margin | FCF margin | ROIC | P/E | F-score | |
|---|---|---|---|---|---|---|---|---|
| Costco COST | $445.9B | 10.1% | 3.9% | 3.1% | 40.7% | — | 7 | |
| Walmart WMT | $956.5B | 4.7% | 4.2% | 2.1% | 16.1% | 43.3x | 7 | Compare → |
| Target TGT | $69.8B | −1.7% | 4.9% | 2.7% | 15.0% | 15.9x | 6 | Compare → |
| Amazon AMZN | $2.70T | 12.4% | 11.2% | 1.1% | 20.6% | 20.0x | 6 | Compare → |
US$ millions unless stated. Hover a ratio's name for its definition.
| Fiscal year | FY17 | FY18 | FY19 | FY20 | FY21 | FY22 | FY23 | FY24 | FY25 | FY26 |
|---|---|---|---|---|---|---|---|---|---|---|
| Income statement | ||||||||||
| Revenue | $129.0B | $141.6B | $152.7B | $166.8B | $195.9B | $227.0B | $242.3B | $254.5B | $275.2B | $303.2B |
| Gross profit | $17.1B | $18.4B | $16.5B | $21.8B | $25.2B | $27.6B | $29.7B | $32.1B | $35.3B | $38.9B |
| Operating income | $4.1B | $4.5B | $4.7B | $5.4B | $6.7B | $7.8B | $8.1B | $9.3B | $10.4B | $11.7B |
| Interest expense | $134M | $159M | $150M | $160M | $171M | $158M | $160M | $169M | $154M | $145M |
| Pretax income | $4.0B | $4.4B | $4.8B | $5.4B | $6.7B | $7.8B | $8.5B | $9.7B | $10.8B | $12.3B |
| Income tax | $1.3B | $1.3B | $1.1B | $1.3B | $1.6B | $1.9B | $2.2B | $2.4B | $2.7B | $3.0B |
| Net income | $2.7B | $3.1B | $3.7B | $4.0B | $5.0B | $5.8B | $6.3B | $7.4B | $8.1B | $9.2B |
| Diluted EPS | $6.08 | $7.09 | $8.26 | $9.02 | $11.27 | $13.14 | $14.16 | $16.56 | $18.21 | $20.76 |
| Diluted shares | 0.44B | 0.44B | 0.44B | 0.44B | 0.44B | 0.44B | 0.44B | 0.44B | 0.44B | 0.44B |
| Cash flow | ||||||||||
| Cash from operations | $6.7B | $5.8B | $6.4B | $8.9B | $9.0B | $7.4B | $11.1B | $11.3B | $13.3B | $15.8B |
| Capital expenditure | $2.5B | $3.0B | $3.0B | $2.8B | $3.6B | $3.9B | $4.3B | $4.7B | $5.5B | $6.4B |
| Free cash flow | $4.2B | $2.8B | $3.4B | $6.1B | $5.4B | $3.5B | $6.7B | $6.6B | $7.8B | $9.4B |
| Depreciation and amortization | $1.4B | $1.4B | $1.5B | $1.6B | $1.8B | $1.9B | $2.1B | $2.2B | $2.4B | $2.7B |
| Stock-based compensation | $514M | $544M | $595M | $619M | $665M | $724M | $774M | $818M | $860M | $924M |
| Acquisitions | $0.0M | $0.0M | $0.0M | $1.2B | $0.0M | $0.0M | $0.0M | $0.0M | $0.0M | $0.0M |
| Share buybacks | $469M | $328M | $247M | $196M | $496M | $439M | $676M | $700M | $903M | $848M |
| Dividends paid | $3.9B | $689M | $1.0B | $1.5B | $5.7B | $1.5B | $1.3B | $9.0B | $2.2B | $2.5B |
| Dividends and buybacks | $4.4B | $1.0B | $1.3B | $1.7B | $6.2B | $1.9B | $1.9B | $9.7B | $3.1B | $3.3B |
| Balance sheet | ||||||||||
| Cash and short-term investments | $5.8B | $7.3B | $9.4B | $13.3B | $12.2B | $11.0B | $15.2B | $11.1B | $15.3B | $21.3B |
| Total debt | $6.7B | $6.6B | $6.9B | $7.7B | $7.6B | $6.6B | $6.5B | $5.9B | $5.8B | $6.2B |
| Finance lease liabilities | $0.0M | $0.0M | $0.0M | $688M | $1.1B | — | $0.0M | $1.5B | $1.5B | $1.4B |
| Current assets | $17.3B | $20.3B | $23.5B | $28.1B | $29.5B | $32.7B | $35.9B | $34.2B | $38.4B | $46.6B |
| Current liabilities | $17.5B | $19.9B | $23.2B | $24.8B | $29.4B | $32.0B | $33.6B | $35.5B | $37.1B | $44.0B |
| Inventory | $9.8B | $11.0B | $11.4B | $12.2B | $14.2B | $17.9B | $16.7B | $18.6B | $18.1B | $19.3B |
| Property and equipment, net | $18.2B | $19.7B | $20.9B | $21.8B | $23.5B | $24.6B | $26.7B | $29.0B | $31.9B | $35.6B |
| Total assets | $36.3B | $40.8B | $45.4B | $55.6B | $59.3B | $64.2B | $69.0B | $69.8B | $77.1B | $89.0B |
| Total liabilities | $25.3B | $27.7B | $29.8B | $36.9B | $41.2B | $43.5B | $43.9B | $46.2B | $47.9B | $53.2B |
| Shareholders' equity | $10.8B | $12.8B | $15.2B | $18.3B | $17.6B | $20.6B | $25.1B | $23.6B | $29.2B | $35.8B |
| Margins | ||||||||||
| Gross margin | 13.3% | 13.0% | 10.8% | 13.1% | 12.9% | 12.2% | 12.3% | 12.6% | 12.8% | 12.8% |
| Operating margin | 3.2% | 3.2% | 3.1% | 3.3% | 3.4% | 3.4% | 3.4% | 3.7% | 3.8% | 3.9% |
| EBITDA margin | 4.3% | 4.2% | 4.1% | 4.3% | 4.3% | 4.3% | 4.2% | 4.5% | 4.7% | 4.7% |
| Net margin | 2.1% | 2.2% | 2.4% | 2.4% | 2.6% | 2.6% | 2.6% | 2.9% | 2.9% | 3.0% |
| FCF margin | 3.3% | 2.0% | 2.2% | 3.6% | 2.7% | 1.5% | 2.8% | 2.6% | 2.9% | 3.1% |
| Returns | ||||||||||
| Return on capital | 22.4% | 26.3% | 28.9% | 30.8% | 36.1% | 38.2% | 37.0% | 38.9% | 37.9% | 40.7% |
| Return on capital employed | 22.6% | 22.5% | 22.0% | 20.6% | 22.2% | 25.1% | 24.0% | 26.6% | 27.9% | 27.5% |
| Return on equity | 23.4% | 26.6% | 26.1% | 23.9% | 27.9% | 30.6% | 27.5% | 30.3% | 30.7% | 28.4% |
| Return on assets | 7.7% | 8.1% | 8.5% | 7.9% | 8.7% | 9.5% | 9.5% | 10.6% | 11.0% | 11.1% |
| Growth | ||||||||||
| Revenue growth | 8.7% | 9.7% | 7.9% | 9.2% | 17.5% | 15.8% | 6.8% | 5.0% | 8.2% | 10.1% |
| Net income growth | 14.0% | 17.0% | 16.8% | 9.4% | 25.1% | 16.7% | 7.7% | 17.1% | 9.9% | 13.9% |
| EPS growth | 14.1% | 16.6% | 16.5% | 9.2% | 24.9% | 16.6% | 7.8% | 17.0% | 10.0% | 14.0% |
| FCF growth | 556.9% | −33.6% | 19.7% | 80.2% | −11.3% | −34.8% | 92.7% | −1.7% | 18.2% | 19.7% |
| Share count change | −0.1% | 0.2% | 0.3% | 0.2% | 0.1% | 0.1% | −0.1% | 0.1% | 0.0% | −0.1% |
| Financial health | ||||||||||
| Net debt / EBITDA | 0.2x | −0.1x | −0.4x | −0.7x | −0.4x | −0.5x | −0.9x | −0.3x | −0.6x | −1.0x |
| Debt / equity | 0.6x | 0.5x | 0.5x | 0.5x | 0.5x | 0.3x | 0.3x | 0.3x | 0.3x | 0.2x |
| Interest coverage | 30.7x | 28.2x | 31.6x | 34.0x | 39.2x | 49.3x | 50.7x | 54.9x | 67.4x | 80.6x |
| Current ratio | 1.0x | 1.0x | 1.0x | 1.1x | 1.0x | 1.0x | 1.1x | 1.0x | 1.0x | 1.1x |
| Quick ratio | 0.4x | 0.5x | 0.5x | 0.6x | 0.5x | 0.5x | 0.6x | 0.4x | 0.6x | 0.6x |
| Capital allocation | ||||||||||
| Capex / revenue | 1.9% | 2.1% | 2.0% | 1.7% | 1.8% | 1.7% | 1.8% | 1.9% | 2.0% | 2.1% |
| Stock comp / revenue | 0.4% | 0.4% | 0.4% | 0.4% | 0.3% | 0.3% | 0.3% | 0.3% | 0.3% | 0.3% |
| Payouts / FCF | 103.5% | 36.3% | 38.3% | 27.7% | 116.3% | 55.3% | 28.6% | 147.0% | 39.4% | 35.2% |
| Quality scores | ||||||||||
| Piotroski F-score | 7.0 | 7.0 | 5.0 | 6.0 | 5.0 | 7.0 | 7.0 | 6.0 | 8.0 | 7.0 |
| Altman Z'' | 1.7 | 1.9 | 2.0 | 2.3 | 1.9 | 2.2 | 2.5 | 2.1 | 2.6 | 2.8 |
| Accruals ratio | −11.6% | −6.8% | −6.3% | −9.6% | −6.9% | −2.5% | −7.2% | −5.7% | −7.1% | −7.9% |
Source: SEC EDGAR XBRL filings (CIK 0000909832). Data updated October 9, 2026. Quarterly fourth quarters are the full year minus the first nine months. For information only — not investment advice. Check the original filings before relying on any figure.