



Risultati trimestrali
· DAL
DAL NYSE Passenger Airlines Finanza ES2016–ES2025
Delta Air Lines' revenue rose 2.8% to $63.4 billion in fiscal 2025. Its operating margin was 9.2%, down from 9.7% a year earlier. Free cash flow was $3.8 billion, up 33.2%. It paid out $440 million in dividends and buybacks, 11% of free cash flow. The diluted share count rose 0.9%.
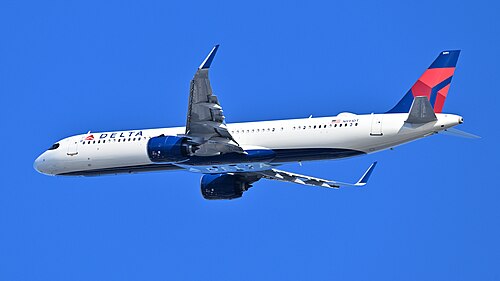
Delta Air Lines flies passengers and cargo across the United States and to six continents. Its main hubs are Atlanta, Detroit, Minneapolis-St. Paul and Salt Lake City, with coastal hubs in Boston, Los Angeles, New York and Seattle. Delta says it carried over 200 million customers in 2025, using a fleet of 1,314 aircraft at year end. Regional airlines, including its own Endeavor Air, fly smaller planes under the Delta Connection name.
Most of its money comes from ticket sales, and Delta is putting more seats in its pricier cabins, such as Delta One and First Class. Its SkyMiles loyalty program is a large second source: Delta sells miles to partners, above all American Express, whose co-branded credit card brought in $8.2 billion in 2025. It also earns money from cargo, from repairing engines and aircraft for other airlines through Delta TechOps, and from Delta Vacations. Delta says the airline industry is highly competitive.
Abroad, Delta works through joint ventures with Air France-KLM, Virgin Atlantic, Aeromexico, LATAM and Korean Air, and owns stakes in several of these carriers. It also owns Monroe Energy, which runs an oil refinery near Philadelphia that supplies jet fuel to its northeastern operations. Delta has more than 100,000 employees.
Delta Air Lines ha registrato $63,4 Mrd di ricavi nell'esercizio 2025, in crescita del 2,8% rispetto all'anno precedente.
Dall'esercizio 2016 al 2025, l'EPS diluito è cresciuto del 3,6% all'anno. I periodi in perdita sono in rosso.
Utile operativo al netto delle imposte in rapporto al capitale investito nell'attività: debito più patrimonio netto, meno liquidità.
Il free cash flow è stato di $3,8 Mrd nell'esercizio 2025, il 6,1% dei ricavi. Flusso di cassa operativo meno investimenti.
Delta Air Lines ha restituito $440 Mln agli azionisti nell'esercizio 2025, il 11% del free cash flow. Il numero di azioni diluite è salito del 0,9%.
Modifica le ipotesi e guarda cosa implicano per azione. Sono modelli, non previsioni né prezzi obiettivo: il risultato dipende interamente da ciò che inserisci.
Valore per azione
—
Aggiunge una liquidità netta di −$9,8 Mrd e divide per 654,0 Mln azioni diluite. Dieci anni di flussi di cassa più un valore terminale, attualizzati a oggi.
Valore per azione
—
Multipli di riferimento: oggi 15,3x · concorrenti 11,4x · settore 26,0x.
Liquidità, debito e gli indici che mostrano quanto agevolmente Delta Air Lines può sostenerlo.
| Chiusura dell'esercizio | ES21 | ES22 | ES23 | ES24 | ES25 |
|---|---|---|---|---|---|
| Liquidità e investimenti a breve termine | $11,3 Mrd | $6,5 Mrd | $3,9 Mrd | $3,1 Mrd | $4,3 Mrd |
| Debito incl. leasing finanziari | $26,9 Mrd | $23,0 Mrd | $20,1 Mrd | $16,2 Mrd | $14,1 Mrd |
| Debito netto / EBITDA | 4,0x | 2,9x | 2,1x | 1,5x | 1,2x |
| Debito / patrimonio netto | 6,9x | 3,5x | 1,8x | 1,1x | 0,7x |
| Copertura degli interessi | 1,2x | 2,9x | 4,7x | 6,0x | 6,9x |
| Indice di liquidità corrente | 0,8x | 0,5x | 0,4x | 0,4x | 0,4x |
| Indice di liquidità immediata | 0,8x | 0,5x | 0,4x | 0,4x | 0,4x |
| Totale attività | $72,5 Mrd | $72,3 Mrd | $73,6 Mrd | $75,4 Mrd | $81,3 Mrd |
| Totale passività | $68,6 Mrd | $65,7 Mrd | $62,5 Mrd | $60,1 Mrd | $60,5 Mrd |
| Patrimonio netto | $3,9 Mrd | $6,6 Mrd | $11,1 Mrd | $15,3 Mrd | $20,9 Mrd |
| Debito netto (− = liquidità netta) | $15,6 Mrd | $16,5 Mrd | $16,2 Mrd | $13,1 Mrd | $9,8 Mrd |
Acquisti e vendite sul mercato di dirigenti, amministratori e azionisti con oltre il 10%, dai Form 4. «Piano» indica le operazioni eseguite nell'ambito di un piano Rule 10b5-1 stabilito in anticipo.
Acquisti, 12 mesi
$0,0 Mln
0 insider
Vendite, 12 mesi
$38,5 Mln
7 insider
Delle vendite, tramite piani
0%
$0,0 Mln
| Data | Insider | Operazione | Azioni | Prezzo | Controvalore | Documento |
|---|---|---|---|---|---|---|
| 5 ago 2026 | Michael P HuertaDirector | Vendite | 3.100 | $94,12 | $0,3 Mln | Form 4 |
| 5 ago 2026 | Steven M SearEVP - Global Sales & Distrib | Vendite | 40.460 | $93,55 | $3,8 Mln | Form 4 |
| 4 ago 2026 | Alain BellemareEVP & Pres. - International | Vendite | 35.000 | $92,72 | $3,2 Mln | Form 4 |
| 4 ago 2026 | Edward H BastianChief Executive Officer, Director | Vendite | 206.510 | $92,80 | $19,2 Mln | Form 4 |
| 4 ago 2026 | Peter W CarterPresident | Vendite | 39.900 | $92,98 | $3,7 Mln | Form 4 |
| 3 ago 2026 | David G DewaltDirector | Vendite | 31.756 | $90,85 | $2,9 Mln | Form 4 |
| 27 mag 2026 | Alain BellemareEVP & Pres. - International | Vendite | 25.000 | $81,44 | $2,0 Mln | Form 4 |
| 27 mag 2026 | Allison C AusbandEVP & Chief People Officer | Vendite | 5.000 | $80,90 | $0,4 Mln | Form 4 |
| 26 mag 2026 | Allison C AusbandEVP & Chief People Officer | Vendite | 5.000 | $79,00 | $0,4 Mln | Form 4 |
| 22 mag 2026 | Allison C AusbandEVP & Chief People Officer | Vendite | 9.710 | $76,00 | $0,7 Mln | Form 4 |
| 21 mag 2026 | Allison C AusbandEVP & Chief People Officer | Vendite | 5.000 | $73,50 | $0,4 Mln | Form 4 |
| 7 mag 2026 | Alain BellemareEVP & Pres. - International | Vendite | 20.621 | $72,75 | $1,5 Mln | Form 4 |
Nove test superato/non superato su redditività, finanziamento ed efficienza. 8–9 è solido, 0–2 debole.
| Test | ES23 | ES24 | ES25 |
|---|---|---|---|
| L'utile netto è positivo | ✓ | ✓ | ✓ |
| Il flusso di cassa operativo è positivo | ✓ | ✓ | ✓ |
| Il rendimento delle attività è salito | ✓ | ✕ | ✓ |
| Il flusso di cassa operativo supera l'utile netto | ✓ | ✓ | ✓ |
| Il debito è sceso rispetto alle attività | ✓ | ✓ | ✓ |
| L'indice di liquidità è salito | ✕ | ✕ | ✓ |
| Il numero di azioni non è aumentato | ✕ | ✕ | ✕ |
| Il margine lordo è salito | — | — | — |
| I ricavi sono saliti rispetto alle attività | ✓ | ✓ | ✓ |
| F-score | 6 / 8 | 5 / 8 | 7 / 8 |
| Rapporto dei ratei | −2,5% | −6,1% | −4,3% |
| Altman Z'' | −0,50 | −0,28 | 0,03 |
Ultimo esercizio di ciascuna azienda. Gli esercizi si chiudono in mesi diversi, quindi i periodi non coincidono esattamente.
| Azienda | Capitalizzazione | Crescita | Marg. op. | Margine FCF | ROIC | P/E | F-score | |
|---|---|---|---|---|---|---|---|---|
| Delta Air Lines DAL | $50,6 Mrd | 2,8% | 9,2% | 6,1% | 16,0% | 15,3x | 7 | |
| United Airlines UAL | $32,1 Mrd | 3,5% | 8,0% | 4,3% | 15,3% | 9,0x | 6 | Confronta → |
| Carnival CCL | $35,7 Mrd | 6,4% | 16,8% | 9,8% | 12,1% | 11,4x | 7 | Confronta → |
| FedEx FDX | $71,4 Mrd | 7,7% | 5,8% | 5,4% | 9,4% | — | 7 | Confronta → |
Importi in USD. Passa il cursore sul nome di un indice per vederne la definizione.
| Esercizio | ES16 | ES17 | ES18 | ES19 | ES20 | ES21 | ES22 | ES23 | ES24 | ES25 |
|---|---|---|---|---|---|---|---|---|---|---|
| Conto economico | ||||||||||
| Ricavi | $39,6 Mrd | $41,2 Mrd | $44,4 Mrd | $47,0 Mrd | $17,1 Mrd | $29,9 Mrd | $50,6 Mrd | $58,0 Mrd | $61,6 Mrd | $63,4 Mrd |
| Utile operativo | $7,0 Mrd | $6,0 Mrd | $5,3 Mrd | $6,6 Mrd | −$12,5 Mrd | $1,9 Mrd | $3,7 Mrd | $5,5 Mrd | $6,0 Mrd | $5,8 Mrd |
| Oneri finanziari | $388 Mln | $396 Mln | $376 Mln | $481 Mln | $761 Mln | $1,5 Mrd | $1,3 Mrd | $1,2 Mrd | $1,0 Mrd | $850 Mln |
| Utile ante imposte | $6,4 Mrd | $5,5 Mrd | $5,2 Mrd | $6,2 Mrd | −$15,6 Mrd | $398 Mln | $1,9 Mrd | $5,6 Mrd | $4,7 Mrd | $6,2 Mrd |
| Imposte sul reddito | $2,2 Mrd | $2,3 Mrd | $1,2 Mrd | $1,4 Mrd | −$3,2 Mrd | $118 Mln | $596 Mln | $999 Mln | $1,2 Mrd | $1,2 Mrd |
| Utile netto | $4,2 Mrd | $3,2 Mrd | $3,9 Mrd | $4,8 Mrd | −$12,4 Mrd | $280 Mln | $1,3 Mrd | $4,6 Mrd | $3,5 Mrd | $5,0 Mrd |
| EPS diluito | $5,55 | $4,43 | $5,67 | $7,30 | −$19,49 | $0,44 | $2,06 | $7,17 | $5,33 | $7,66 |
| Azioni diluite | 0,76 Mrd | 0,72 Mrd | 0,69 Mrd | 0,65 Mrd | 0,64 Mrd | 0,64 Mrd | 0,64 Mrd | 0,64 Mrd | 0,65 Mrd | 0,65 Mrd |
| Flussi di cassa | ||||||||||
| Flusso di cassa operativo | $7,2 Mrd | $5,0 Mrd | $7,0 Mrd | $8,4 Mrd | −$3,8 Mrd | $3,3 Mrd | $6,4 Mrd | $6,5 Mrd | $8,0 Mrd | $8,3 Mrd |
| Investimenti in capitale (capex) | $3,4 Mrd | $3,9 Mrd | $5,2 Mrd | $4,9 Mrd | $1,9 Mrd | $3,2 Mrd | $6,4 Mrd | $5,3 Mrd | $5,1 Mrd | $4,5 Mrd |
| Free cash flow | $3,8 Mrd | $1,1 Mrd | $1,8 Mrd | $3,5 Mrd | −$5,7 Mrd | $17,0 Mln | −$3,0 Mln | $1,1 Mrd | $2,9 Mrd | $3,8 Mrd |
| Ammortamenti | $1,9 Mrd | $2,2 Mrd | $2,3 Mrd | $2,6 Mrd | $2,3 Mrd | $2,0 Mrd | $2,1 Mrd | $2,3 Mrd | $2,5 Mrd | $2,4 Mrd |
| Compensi in azioni | $154 Mln | $169 Mln | $159 Mln | $161 Mln | $119 Mln | $149 Mln | $150 Mln | $180 Mln | $236 Mln | $313 Mln |
| Acquisizioni | $0,0 Mln | $0,0 Mln | $0,0 Mln | $0,0 Mln | $0,0 Mln | $0,0 Mln | $0,0 Mln | $0,0 Mln | $0,0 Mln | $0,0 Mln |
| Riacquisti di azioni | $2,6 Mrd | $1,7 Mrd | $1,6 Mrd | $2,0 Mrd | $344 Mln | $0,0 Mln | $0,0 Mln | $0,0 Mln | $0,0 Mln | $0,0 Mln |
| Dividendi pagati | $509 Mln | $731 Mln | $909 Mln | $980 Mln | $260 Mln | $0,0 Mln | $0,0 Mln | $128 Mln | $321 Mln | $440 Mln |
| Dividendi e riacquisti | $3,1 Mrd | $2,4 Mrd | $2,5 Mrd | $3,0 Mrd | $604 Mln | $0,0 Mln | $0,0 Mln | $128 Mln | $321 Mln | $440 Mln |
| Stato patrimoniale | ||||||||||
| Liquidità e investimenti a breve termine | $3,2 Mrd | $2,6 Mrd | $1,8 Mrd | $2,9 Mrd | $14,1 Mrd | $11,3 Mrd | $6,5 Mrd | $3,9 Mrd | $3,1 Mrd | $4,3 Mrd |
| Debito totale | $7,0 Mrd | $8,4 Mrd | $9,4 Mrd | $10,1 Mrd | $28,0 Mrd | $25,1 Mrd | $21,4 Mrd | $18,6 Mrd | $15,3 Mrd | $13,3 Mrd |
| Passività per leasing finanziari | $0,0 Mln | $0,0 Mln | $403 Mln | $1,1 Mrd | $1,2 Mrd | $1,8 Mrd | $1,6 Mrd | $1,4 Mrd | $847 Mln | $805 Mln |
| Attività correnti | $7,5 Mrd | $7,8 Mrd | $6,3 Mrd | $8,2 Mrd | $17,4 Mrd | $15,9 Mrd | $13,0 Mrd | $10,3 Mrd | $9,8 Mrd | $11,0 Mrd |
| Passività correnti | $15,2 Mrd | $19,0 Mrd | $18,6 Mrd | $20,2 Mrd | $15,9 Mrd | $21,0 Mrd | $25,9 Mrd | $26,4 Mrd | $26,7 Mrd | $27,6 Mrd |
| Rimanenze | $519 Mln | $916 Mln | $592 Mln | $0,0 Mln | $0,0 Mln | $0,0 Mln | $0,0 Mln | $0,0 Mln | $0,0 Mln | $0,0 Mln |
| Immobili, impianti e macchinari, netti | $24,4 Mrd | $26,6 Mrd | $28,3 Mrd | $31,3 Mrd | $26,5 Mrd | $28,7 Mrd | $33,1 Mrd | $35,5 Mrd | $37,6 Mrd | $39,7 Mrd |
| Totale attività | $51,9 Mrd | $53,7 Mrd | $60,3 Mrd | $64,5 Mrd | $72,0 Mrd | $72,5 Mrd | $72,3 Mrd | $73,6 Mrd | $75,4 Mrd | $81,3 Mrd |
| Totale passività | $40,0 Mrd | $41,1 Mrd | $46,6 Mrd | $49,2 Mrd | $70,5 Mrd | $68,6 Mrd | $65,7 Mrd | $62,5 Mrd | $60,1 Mrd | $60,5 Mrd |
| Patrimonio netto | $11,3 Mrd | $12,5 Mrd | $13,7 Mrd | $15,4 Mrd | $1,5 Mrd | $3,9 Mrd | $6,6 Mrd | $11,1 Mrd | $15,3 Mrd | $20,9 Mrd |
| Margini | ||||||||||
| Margine operativo | 17,7% | 14,5% | 11,9% | 14,1% | −72,9% | 6,3% | 7,2% | 9,5% | 9,7% | 9,2% |
| Margine EBITDA | 22,4% | 19,9% | 17,1% | 19,6% | −59,4% | 13,0% | 11,4% | 13,5% | 13,8% | 13,0% |
| Margine netto | 10,6% | 7,8% | 8,9% | 10,1% | −72,5% | 0,9% | 2,6% | 7,9% | 5,6% | 7,9% |
| Margine FCF | 9,7% | 2,7% | 4,2% | 7,4% | −33,3% | 0,1% | −0,0% | 2,0% | 4,7% | 6,1% |
| Rendimenti | ||||||||||
| Rendimento del capitale | — | 20,8% | 20,1% | 22,5% | −49,0% | 7,4% | 11,9% | 18,0% | 16,0% | 16,0% |
| Rendimento del capitale impiegato | 19,4% | 16,7% | 13,8% | 15,4% | −24,8% | 3,5% | 7,5% | 11,8% | 12,5% | 11,4% |
| Rendimento del patrimonio netto | 37,9% | 26,9% | 30,0% | 32,8% | −146,6% | — | 25,2% | 52,1% | 26,2% | 27,7% |
| Rendimento delle attività | 8,0% | 6,1% | 6,9% | 7,6% | −18,1% | 0,4% | 1,8% | 6,3% | 4,6% | 6,4% |
| Crescita | ||||||||||
| Crescita dei ricavi | −2,6% | 4,1% | 7,7% | 5,8% | −63,6% | 74,9% | 69,2% | 14,8% | 6,2% | 2,8% |
| Crescita dell'utile netto | −7,3% | −23,6% | 22,8% | 21,1% | −359,8% | — | 370,7% | 249,7% | −25,0% | 44,8% |
| Crescita dell'EPS | −1,4% | −20,2% | 28,0% | 28,8% | −367,0% | — | 368,2% | 248,1% | −25,7% | 43,7% |
| Crescita dell'FCF | −23,2% | −70,4% | 63,1% | 89,0% | −263,1% | — | −117,7% | — | 152,9% | 33,2% |
| Variazione del numero di azioni | −6,1% | −4,2% | −4,0% | −5,9% | −2,6% | 0,8% | 0,0% | 0,3% | 0,8% | 0,9% |
| Solidità finanziaria | ||||||||||
| Debito netto / EBITDA | 0,4x | 0,7x | 1,1x | 0,9x | — | 4,0x | 2,9x | 2,1x | 1,5x | 1,2x |
| Debito / patrimonio netto | 0,6x | 0,7x | 0,7x | 0,7x | — | 6,9x | 3,5x | 1,8x | 1,1x | 0,7x |
| Copertura degli interessi | 18,0x | 15,1x | 14,0x | 13,8x | −16,4x | 1,2x | 2,9x | 4,7x | 6,0x | 6,9x |
| Indice di liquidità corrente | 0,5x | 0,4x | 0,3x | 0,4x | 1,1x | 0,8x | 0,5x | 0,4x | 0,4x | 0,4x |
| Indice di liquidità immediata | 0,5x | 0,4x | 0,3x | 0,4x | 1,1x | 0,8x | 0,5x | 0,4x | 0,4x | 0,4x |
| Allocazione del capitale | ||||||||||
| Capex / ricavi | 8,6% | 9,4% | 11,6% | 10,5% | 11,1% | 10,9% | 12,6% | 9,2% | 8,3% | 7,1% |
| Compensi in azioni / ricavi | 0,4% | 0,4% | 0,4% | 0,3% | 0,7% | 0,5% | 0,3% | 0,3% | 0,4% | 0,5% |
| Distribuzioni / FCF | 81,3% | 212,7% | 134,6% | 86,2% | — | 0,0% | — | 11,2% | 11,1% | 11,5% |
| Punteggi di qualità | ||||||||||
| F-score di Piotroski | — | 5,0 | 6,0 | 7,0 | 3,0 | 6,0 | 7,0 | 6,0 | 5,0 | 7,0 |
| Z'' di Altman | 0,7 | 0,2 | 0,1 | 0,4 | −1,0 | −0,2 | −0,7 | −0,5 | −0,3 | 0,0 |
| Rapporto dei ratei | −5,8% | −3,5% | −5,4% | −5,9% | −12,6% | −4,1% | −7,0% | −2,5% | −6,1% | −4,3% |
Fonte: documenti SEC EDGAR XBRL (CIK 0000027904). Dati aggiornati il 9 ottobre 2026. I quarti trimestri sono l'intero anno meno i primi nove mesi. Solo a scopo informativo: non è una consulenza finanziaria. Verifica i documenti originali prima di basarti su un dato.