




Risultati annuali
· MSFT
MSFT Nasdaq Systems Software Finanza ES2017–ES2026
Microsoft's revenue rose 17.8% to $331.8 billion in fiscal 2026. Its operating margin was 46.8%, up from 45.6% a year earlier. Free cash flow was $67.0 billion, down 6.5%. It paid out $48.7 billion in dividends and buybacks, 73% of free cash flow. The diluted share count fell 0.2%.
Microsoft makes software, cloud computing services and devices for people, businesses and governments around the world. Its products include the Windows operating system, the Microsoft 365 office apps and Teams, the Azure cloud platform, the LinkedIn professional network, Dynamics business software, the Bing search engine, Surface computers and Xbox consoles and games. It is adding artificial intelligence tools, such as its Copilot assistants, across these products.
It reports three segments. Productivity and Business Processes covers Microsoft 365, LinkedIn and Dynamics. Intelligent Cloud covers Azure, server software and consulting services. More Personal Computing covers Windows licenses sold with new PCs, devices, Xbox and search advertising. It earns money from cloud subscriptions, software licenses, online ads and device sales. In the year to June 2026, total revenue grew 18%, and revenue from what Microsoft calls the Microsoft Cloud reached $214.4 billion; Azure and related cloud revenue grew 41%. Microsoft says it competes with other cloud providers, makers of AI models, rival device makers and operating systems, free ad-supported apps, open-source software, gaming platforms and search engines.
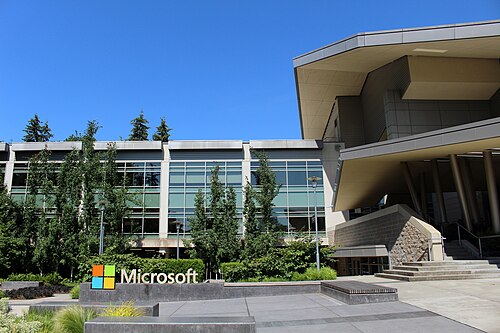
Microsoft employs about 223,000 people full time, roughly 121,000 of them in the United States, and is based in Redmond, Washington. It calls itself a major investor in OpenAI, with which it has a long-term partnership, and it bought the game publisher Activision Blizzard in 2023.
Microsoft ha registrato $331,8 Mrd di ricavi nell'esercizio 2026, in crescita del 17,8% rispetto all'anno precedente.
Dall'esercizio 2017 al 2026, l'EPS diluito è cresciuto del 20,9% all'anno. I periodi in perdita sono in rosso.
Utile operativo al netto delle imposte in rapporto al capitale investito nell'attività: debito più patrimonio netto, meno liquidità.
Il free cash flow è stato di $67,0 Mrd nell'esercizio 2026, il 20,2% dei ricavi. Flusso di cassa operativo meno investimenti.
Microsoft ha restituito $48,7 Mrd agli azionisti nell'esercizio 2026, il 73% del free cash flow. Il numero di azioni diluite è sceso del 0,2%.
Modifica le ipotesi e guarda cosa implicano per azione. Sono modelli, non previsioni né prezzi obiettivo: il risultato dipende interamente da ciò che inserisci.
Valore per azione
—
Aggiunge una liquidità netta di −$30,0 Mrd e divide per 7.453,0 Mln azioni diluite. Dieci anni di flussi di cassa più un valore terminale, attualizzati a oggi.
Valore per azione
—
Multipli di riferimento: oggi 29,2x · concorrenti 20,9x · settore 33,5x.
Liquidità, debito e gli indici che mostrano quanto agevolmente Microsoft può sostenerlo.
| Chiusura dell'esercizio | ES22 | ES23 | ES24 | ES25 | ES26 |
|---|---|---|---|---|---|
| Liquidità e investimenti a breve termine | $104,8 Mrd | $111,3 Mrd | $75,5 Mrd | $94,6 Mrd | $76,8 Mrd |
| Debito incl. leasing finanziari | $64,7 Mrd | $64,3 Mrd | $78,8 Mrd | $89,3 Mrd | $106,9 Mrd |
| Debito netto / EBITDA | −0,4x | −0,5x | 0,0x | −0,0x | 0,2x |
| Debito / patrimonio netto | 0,4x | 0,3x | 0,3x | 0,3x | 0,2x |
| Copertura degli interessi | 40,4x | 45,0x | 37,3x | 53,9x | 50,9x |
| Indice di liquidità corrente | 1,8x | 1,8x | 1,3x | 1,4x | 1,2x |
| Indice di liquidità immediata | 1,8x | 1,8x | 1,3x | 1,4x | 1,2x |
| Totale attività | $364,8 Mrd | $412,0 Mrd | $512,2 Mrd | $619,0 Mrd | $758,4 Mrd |
| Totale passività | $198,3 Mrd | $205,8 Mrd | $243,7 Mrd | $275,5 Mrd | $316,0 Mrd |
| Patrimonio netto | $166,5 Mrd | $206,2 Mrd | $268,5 Mrd | $343,5 Mrd | $442,4 Mrd |
| Debito netto (− = liquidità netta) | −$40,1 Mrd | −$47,0 Mrd | $3,2 Mrd | −$5,2 Mrd | $30,0 Mrd |
Acquisti e vendite sul mercato di dirigenti, amministratori e azionisti con oltre il 10%, dai Form 4. «Piano» indica le operazioni eseguite nell'ambito di un piano Rule 10b5-1 stabilito in anticipo.
Acquisti, 12 mesi
$2,0 Mln
1 insider
Vendite, 12 mesi
$92,3 Mln
6 insider
Delle vendite, tramite piani
74%
$68,1 Mln
| Data | Insider | Operazione | Azioni | Prezzo | Controvalore | Documento |
|---|---|---|---|---|---|---|
| 13 ott 2026 | Amy HoodEVP, Chief Financial Officer | Vendite piano | 7.305 | $545,42 | $4,0 Mln | Form 4 |
| 14 set 2026 | Amy HoodEVP, Chief Financial Officer | Vendite piano | 41.674 | $498,27 | $20,8 Mln | Form 4 |
| 1 set 2026 | Satya NadellaChief Executive Officer, Director | Vendite piano | 86.525 | $501,46 | $43,4 Mln | Form 4 |
| 5 ago 2026 | Judson AlthoffCEO Microsoft Commercial | Vendite | 10.000 | $487,89 | $4,9 Mln | Form 4 |
| 4 ago 2026 | Takeshi NumotoEVP, Chief Marketing Officer | Vendite | 4.810 | $496,48 | $2,4 Mln | Form 4 |
| 10 giu 2026 | Takeshi NumotoEVP, Chief Marketing Officer | Vendite | 4.500 | $402,84 | $1,8 Mln | Form 4 |
| 8 giu 2026 | Takeshi NumotoEVP, Chief Marketing Officer | Vendite | 2.500 | $412,45 | $1,0 Mln | Form 4 |
| 1 giu 2026 | Judson AlthoffCEO Microsoft Commercial | Vendite | 15.500 | $460,99 | $7,1 Mln | Form 4 |
| 14 mag 2026 | Amy ColemanEVP, Chief Human Resources Off | Vendite | 1.262 | $411,34 | $0,5 Mln | Form 4 |
| 6 mar 2026 | Kathleen T HoganEVP, Strategy | Vendite | 12.321 | $409,52 | $5,0 Mln | Form 4 |
| 18 feb 2026 | John W StantonDirector | Acquisti | 5.000 | $397,35 | $2,0 Mln | Form 4 |
| 4 dic 2025 | Takeshi NumotoEVP, Chief Marketing Officer | Vendite | 2.850 | $478,72 | $1,4 Mln | Form 4 |
Nove test superato/non superato su redditività, finanziamento ed efficienza. 8–9 è solido, 0–2 debole.
| Test | ES24 | ES25 | ES26 |
|---|---|---|---|
| L'utile netto è positivo | ✓ | ✓ | ✓ |
| Il flusso di cassa operativo è positivo | ✓ | ✓ | ✓ |
| Il rendimento delle attività è salito | ✓ | ✕ | ✓ |
| Il flusso di cassa operativo supera l'utile netto | ✓ | ✓ | ✓ |
| Il debito è sceso rispetto alle attività | ✓ | ✓ | ✓ |
| L'indice di liquidità è salito | ✕ | ✓ | ✕ |
| Il numero di azioni non è aumentato | ✓ | ✓ | ✓ |
| Il margine lordo è salito | ✓ | ✕ | ✕ |
| I ricavi sono saliti rispetto alle attività | ✓ | ✕ | ✕ |
| F-score | 8 / 9 | 6 / 9 | 6 / 9 |
| Rapporto dei ratei | −6,6% | −6,1% | −7,1% |
| Altman Z'' | 4,14 | 4,49 | 4,59 |
Ultimo esercizio di ciascuna azienda. Gli esercizi si chiudono in mesi diversi, quindi i periodi non coincidono esattamente.
| Azienda | Capitalizzazione | Crescita | Marg. op. | Margine FCF | ROIC | P/E | F-score | |
|---|---|---|---|---|---|---|---|---|
| Microsoft MSFT | $3,91 Bln | 17,8% | 46,8% | 20,2% | 30,9% | — | 6 | |
| Apple AAPL | $5,12 Bln | 6,4% | 32,0% | 23,7% | 102,9% | 39,9x | 8 | Confronta → |
| Alphabet GOOGL | $3,94 Bln | 15,1% | 32,0% | 18,2% | 36,7% | 16,1x | 8 | Confronta → |
| Amazon AMZN | $2,70 Bln | 12,4% | 11,2% | 1,1% | 20,6% | 20,0x | 6 | Confronta → |
| Meta Platforms META | $1,65 Bln | 22,2% | 41,4% | 22,9% | 35,5% | 21,9x | 6 | Confronta → |
Importi in USD. Passa il cursore sul nome di un indice per vederne la definizione.
| Esercizio | ES17 | ES18 | ES19 | ES20 | ES21 | ES22 | ES23 | ES24 | ES25 | ES26 |
|---|---|---|---|---|---|---|---|---|---|---|
| Conto economico | ||||||||||
| Ricavi | $96,6 Mrd | $110,4 Mrd | $125,8 Mrd | $143,0 Mrd | $168,1 Mrd | $198,3 Mrd | $211,9 Mrd | $245,1 Mrd | $281,7 Mrd | $331,8 Mrd |
| Utile lordo | $62,3 Mrd | $72,0 Mrd | $82,9 Mrd | $96,9 Mrd | $115,9 Mrd | $135,6 Mrd | $146,1 Mrd | $171,0 Mrd | $193,9 Mrd | $225,5 Mrd |
| Ricerca e sviluppo | $13,0 Mrd | $14,7 Mrd | $16,9 Mrd | $19,3 Mrd | $20,7 Mrd | $24,5 Mrd | $27,2 Mrd | $29,5 Mrd | $32,5 Mrd | $35,6 Mrd |
| Utile operativo | $29,0 Mrd | $35,1 Mrd | $43,0 Mrd | $53,0 Mrd | $69,9 Mrd | $83,4 Mrd | $88,5 Mrd | $109,4 Mrd | $128,5 Mrd | $155,2 Mrd |
| Oneri finanziari | $2,2 Mrd | $2,7 Mrd | $2,7 Mrd | $2,6 Mrd | $2,3 Mrd | $2,1 Mrd | $2,0 Mrd | $2,9 Mrd | $2,4 Mrd | $3,1 Mrd |
| Utile ante imposte | $29,9 Mrd | $36,5 Mrd | $43,7 Mrd | $53,0 Mrd | $71,1 Mrd | $83,7 Mrd | $89,3 Mrd | $107,8 Mrd | $123,6 Mrd | $165,9 Mrd |
| Imposte sul reddito | $4,4 Mrd | $19,9 Mrd | $4,4 Mrd | $8,8 Mrd | $9,8 Mrd | $11,0 Mrd | $17,0 Mrd | $19,7 Mrd | $21,8 Mrd | $32,2 Mrd |
| Utile netto | $25,5 Mrd | $16,6 Mrd | $39,2 Mrd | $44,3 Mrd | $61,3 Mrd | $72,7 Mrd | $72,4 Mrd | $88,1 Mrd | $101,8 Mrd | $133,7 Mrd |
| EPS diluito | $3,25 | $2,13 | $5,06 | $5,76 | $8,05 | $9,65 | $9,68 | $11,80 | $13,64 | $17,95 |
| Azioni diluite | 7,83 Mrd | 7,79 Mrd | 7,75 Mrd | 7,68 Mrd | 7,61 Mrd | 7,54 Mrd | 7,47 Mrd | 7,47 Mrd | 7,47 Mrd | 7,45 Mrd |
| Flussi di cassa | ||||||||||
| Flusso di cassa operativo | $39,5 Mrd | $43,9 Mrd | $52,2 Mrd | $60,7 Mrd | $76,7 Mrd | $89,0 Mrd | $87,6 Mrd | $118,5 Mrd | $136,2 Mrd | $182,9 Mrd |
| Investimenti in capitale (capex) | $8,1 Mrd | $11,6 Mrd | $13,9 Mrd | $15,4 Mrd | $20,6 Mrd | $23,9 Mrd | $28,1 Mrd | $44,5 Mrd | $64,6 Mrd | $115,9 Mrd |
| Free cash flow | $31,4 Mrd | $32,3 Mrd | $38,3 Mrd | $45,2 Mrd | $56,1 Mrd | $65,1 Mrd | $59,5 Mrd | $74,1 Mrd | $71,6 Mrd | $67,0 Mrd |
| Ammortamenti | $7,8 Mrd | $9,9 Mrd | $11,6 Mrd | $12,3 Mrd | $10,9 Mrd | $14,6 Mrd | $13,5 Mrd | $20,0 Mrd | $28,0 Mrd | $39,0 Mrd |
| Compensi in azioni | $3,3 Mrd | $3,9 Mrd | $4,7 Mrd | $5,3 Mrd | $6,1 Mrd | $7,5 Mrd | $9,6 Mrd | $10,7 Mrd | $12,0 Mrd | $12,4 Mrd |
| Acquisizioni | $0,0 Mln | $0,0 Mln | $0,0 Mln | $0,0 Mln | $0,0 Mln | $0,0 Mln | $0,0 Mln | $0,0 Mln | $0,0 Mln | $0,0 Mln |
| Riacquisti di azioni | $11,8 Mrd | $10,7 Mrd | $19,5 Mrd | $23,0 Mrd | $27,4 Mrd | $32,7 Mrd | $22,2 Mrd | $17,3 Mrd | $18,4 Mrd | $22,3 Mrd |
| Dividendi pagati | $11,8 Mrd | $12,7 Mrd | $13,8 Mrd | $15,1 Mrd | $16,5 Mrd | $18,1 Mrd | $19,8 Mrd | $21,8 Mrd | $24,1 Mrd | $26,4 Mrd |
| Dividendi e riacquisti | $23,6 Mrd | $23,4 Mrd | $33,4 Mrd | $38,1 Mrd | $43,9 Mrd | $50,8 Mrd | $42,0 Mrd | $39,0 Mrd | $42,5 Mrd | $48,7 Mrd |
| Stato patrimoniale | ||||||||||
| Liquidità e investimenti a breve termine | $133,0 Mrd | $133,8 Mrd | $133,8 Mrd | $136,5 Mrd | $130,3 Mrd | $104,8 Mrd | $111,3 Mrd | $75,5 Mrd | $94,6 Mrd | $76,8 Mrd |
| Debito totale | $86,2 Mrd | $76,2 Mrd | $72,2 Mrd | $63,3 Mrd | $58,1 Mrd | $49,8 Mrd | $47,2 Mrd | $51,6 Mrd | $43,2 Mrd | $40,3 Mrd |
| Passività per leasing finanziari | $2,5 Mrd | $4,3 Mrd | $6,6 Mrd | $9,5 Mrd | $12,5 Mrd | $14,9 Mrd | $17,1 Mrd | $27,1 Mrd | $46,2 Mrd | $66,6 Mrd |
| Attività correnti | $162,7 Mrd | $169,7 Mrd | $175,6 Mrd | $181,9 Mrd | $184,4 Mrd | $169,7 Mrd | $184,3 Mrd | $159,7 Mrd | $191,1 Mrd | $207,7 Mrd |
| Passività correnti | $55,7 Mrd | $58,5 Mrd | $69,4 Mrd | $72,3 Mrd | $88,7 Mrd | $95,1 Mrd | $104,1 Mrd | $125,3 Mrd | $141,2 Mrd | $168,8 Mrd |
| Rimanenze | $2,2 Mrd | $2,7 Mrd | $2,1 Mrd | $1,9 Mrd | $2,6 Mrd | $3,7 Mrd | $2,5 Mrd | $1,2 Mrd | $938 Mln | $1,4 Mrd |
| Immobili, impianti e macchinari, netti | $23,7 Mrd | $29,5 Mrd | $36,5 Mrd | $44,2 Mrd | $59,7 Mrd | $74,4 Mrd | $95,6 Mrd | $135,6 Mrd | $205,0 Mrd | $313,1 Mrd |
| Totale attività | $250,3 Mrd | $258,8 Mrd | $286,6 Mrd | $301,3 Mrd | $333,8 Mrd | $364,8 Mrd | $412,0 Mrd | $512,2 Mrd | $619,0 Mrd | $758,4 Mrd |
| Totale passività | $162,6 Mrd | $176,1 Mrd | $184,2 Mrd | $183,0 Mrd | $191,8 Mrd | $198,3 Mrd | $205,8 Mrd | $243,7 Mrd | $275,5 Mrd | $316,0 Mrd |
| Patrimonio netto | $87,7 Mrd | $82,7 Mrd | $102,3 Mrd | $118,3 Mrd | $142,0 Mrd | $166,5 Mrd | $206,2 Mrd | $268,5 Mrd | $343,5 Mrd | $442,4 Mrd |
| Margini | ||||||||||
| Margine lordo | 64,5% | 65,3% | 65,9% | 67,8% | 68,9% | 68,4% | 68,9% | 69,8% | 68,8% | 67,9% |
| Margine operativo | 30,1% | 31,8% | 34,1% | 37,0% | 41,6% | 42,1% | 41,8% | 44,6% | 45,6% | 46,8% |
| Margine EBITDA | 38,1% | 40,7% | 43,4% | 45,6% | 48,1% | 49,4% | 48,1% | 52,8% | 55,6% | 58,5% |
| Margine netto | 26,4% | 15,0% | 31,2% | 31,0% | 36,5% | 36,7% | 34,2% | 36,0% | 36,2% | 40,3% |
| Margine FCF | 32,5% | 29,2% | 30,4% | 31,6% | 33,4% | 32,9% | 28,1% | 30,2% | 25,4% | 20,2% |
| Rendimenti | ||||||||||
| Rendimento del capitale | 74,1% | 48,1% | 100,6% | 86,8% | 88,0% | 69,4% | 50,2% | 41,5% | 34,7% | 30,9% |
| Rendimento del capitale impiegato | 17,7% | 17,8% | 20,6% | 23,7% | 29,5% | 32,4% | 30,7% | 31,5% | 29,7% | 29,1% |
| Rendimento del patrimonio netto | 29,9% | 19,5% | 42,4% | 40,1% | 47,1% | 47,2% | 38,8% | 37,1% | 33,3% | 34,0% |
| Rendimento delle attività | 11,5% | 6,5% | 14,4% | 15,1% | 19,3% | 20,8% | 18,6% | 19,1% | 18,0% | 19,4% |
| Crescita | ||||||||||
| Crescita dei ricavi | 5,9% | 14,3% | 14,0% | 13,7% | 17,5% | 18,0% | 6,9% | 15,7% | 14,9% | 17,8% |
| Crescita dell'utile netto | 24,1% | −35,0% | 136,8% | 12,9% | 38,4% | 18,7% | −0,5% | 21,8% | 15,5% | 31,3% |
| Crescita dell'EPS | 27,0% | −34,5% | 137,6% | 13,8% | 39,8% | 19,9% | 0,3% | 21,9% | 15,6% | 31,6% |
| Crescita dell'FCF | 25,6% | 2,8% | 18,6% | 18,2% | 24,1% | 16,1% | −8,7% | 24,5% | −3,3% | −6,5% |
| Variazione del numero di azioni | −2,3% | −0,5% | −0,5% | −0,9% | −1,0% | −0,9% | −0,9% | −0,0% | −0,1% | −0,2% |
| Solidità finanziaria | ||||||||||
| Debito netto / EBITDA | −1,2x | −1,2x | −1,0x | −1,0x | −0,7x | −0,4x | −0,5x | 0,0x | −0,0x | 0,2x |
| Debito / patrimonio netto | 1,0x | 1,0x | 0,8x | 0,6x | 0,5x | 0,4x | 0,3x | 0,3x | 0,3x | 0,2x |
| Copertura degli interessi | 13,1x | 12,8x | 16,0x | 20,4x | 29,8x | 40,4x | 45,0x | 37,3x | 53,9x | 50,9x |
| Indice di liquidità corrente | 2,9x | 2,9x | 2,5x | 2,5x | 2,1x | 1,8x | 1,8x | 1,3x | 1,4x | 1,2x |
| Indice di liquidità immediata | 2,9x | 2,9x | 2,5x | 2,5x | 2,1x | 1,8x | 1,8x | 1,3x | 1,4x | 1,2x |
| Allocazione del capitale | ||||||||||
| Capex / ricavi | 8,4% | 10,5% | 11,1% | 10,8% | 12,3% | 12,1% | 13,3% | 18,1% | 22,9% | 34,9% |
| Compensi in azioni / ricavi | 3,4% | 3,6% | 3,7% | 3,7% | 3,6% | 3,8% | 4,5% | 4,4% | 4,3% | 3,7% |
| Distribuzioni / FCF | 75,3% | 72,6% | 87,2% | 84,2% | 78,2% | 78,0% | 70,7% | 52,7% | 59,4% | 72,7% |
| Punteggi di qualità | ||||||||||
| F-score di Piotroski | 7,0 | 6,0 | 8,0 | 8,0 | 8,0 | 7,0 | 6,0 | 8,0 | 6,0 | 6,0 |
| Z'' di Altman | 4,4 | 4,4 | 4,3 | 4,6 | 4,6 | 4,5 | 4,7 | 4,1 | 4,5 | 4,6 |
| Rapporto dei ratei | −6,3% | −10,7% | −4,8% | −5,6% | −4,9% | −4,7% | −3,9% | −6,6% | −6,1% | −7,1% |
Fonte: documenti SEC EDGAR XBRL (CIK 0000789019). Dati aggiornati il 23 ottobre 2026. I quarti trimestri sono l'intero anno meno i primi nove mesi. Solo a scopo informativo: non è una consulenza finanziaria. Verifica i documenti originali prima di basarti su un dato.