Labcorp raises 2026 outlook after Q3 earnings and cash-flow beat
Labcorp beat third-quarter consensus, raised its 2026 revenue and adjusted-EPS outlook, and reported a sharp improvement in free cash flow.

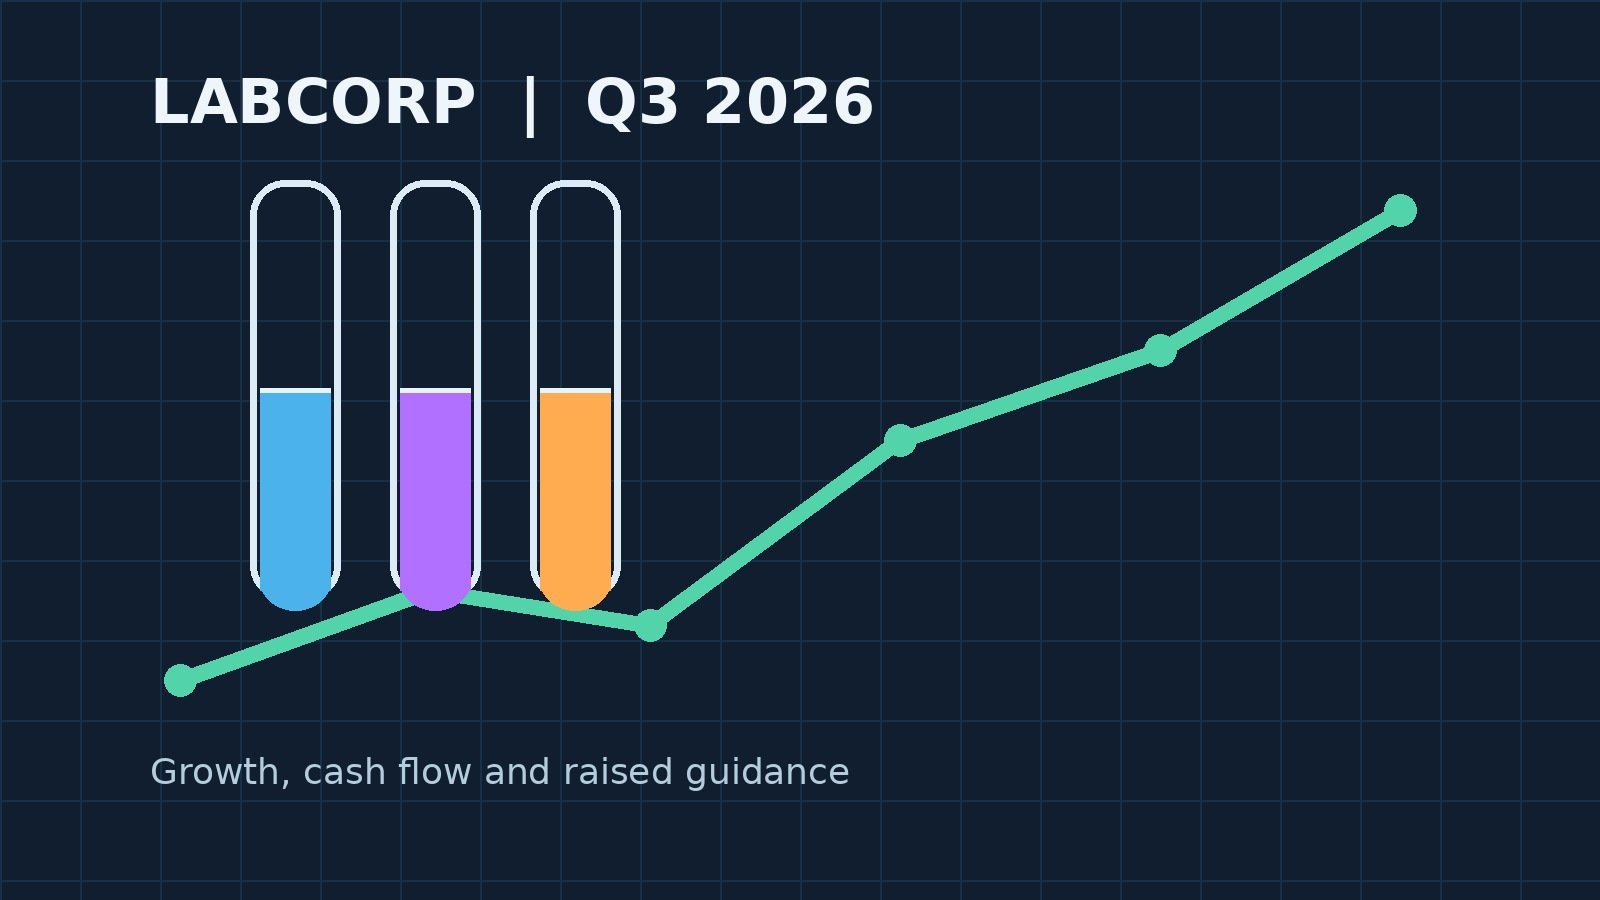
Labcorp reported third-quarter revenue of $3.81 billion, up 6.9% from $3.56 billion a year earlier, while adjusted EPS rose 14.5% to $4.78. Both figures exceeded the approximately $3.76 billion revenue and $4.64 adjusted-EPS consensus cited by MarketBeat.
Growth with margin and cash-flow support
Organic revenue grew 5.5%, while acquisitions contributed 1.5 percentage points. Adjusted operating income increased to $570.0 million from $513.3 million, lifting adjusted operating margin to 15.0% from 14.4%. Operating cash flow reached $563.8 million, compared with $387.2 million in the prior-year quarter; after $151.6 million of capital expenditure, free cash flow was $412.2 million.
Higher outlook, heavier balance-sheet demands
Labcorp raised its 2026 enterprise revenue-growth guidance to 5.9%–6.7%, from 5.4%–6.3%, and its adjusted EPS range to $18.30–$18.70, from $18.12–$18.52. Full-year free-cash-flow guidance remained $1.24–$1.36 billion. The company ended September with $261.8 million of cash and $5.85 billion of debt; it invested $255.5 million in acquisitions during the quarter and paid $58.2 million in dividends.
Q3 revenue
$3.81B
↑ +6.9% YoY reported
Adjusted EPS
$4.78
↑ +14.5% YoY reported
Free cash flow
$412.2M
↑ +47.0% YoY Q3 2026
2026 adjusted EPS guide
$18.30–$18.70
raised range
Sources
Quarterly revenue, Labcorp
Margins by quarter
Twelve quarters of figures
| Quarter | Q3 '23 | Q4 '23 | Q1 '24 | Q2 '24 | Q3 '24 | Q4 '24 | Q1 '25 | Q2 '25 | Q3 '25 | Q4 '25 | Q1 '26 | Q2 '26 |
|---|---|---|---|---|---|---|---|---|---|---|---|---|
| Revenue | $3.1B | $3.0B | $3.2B | $3.2B | $3.3B | $3.3B | $3.3B | $3.5B | $3.6B | $3.5B | $3.5B | $3.7B |
| Revenue growth | 6.6% | 3.5% | 4.6% | 6.2% | 7.4% | 9.8% | 5.3% | 9.5% | 8.6% | 5.6% | 5.8% | 5.8% |
| Gross margin | 27.9% | 27.1% | 28.3% | 28.8% | 27.6% | 26.9% | 28.3% | 29.7% | 28.8% | 28.3% | 28.7% | 29.8% |
| Operating margin | 8.3% | −4.1% | 10.1% | 9.2% | 7.7% | 6.5% | 9.8% | 11.2% | 11.1% | 7.6% | 10.8% | 12.1% |
| Net income | $183M | −$167M | $228M | $205M | $169M | $143M | $213M | $238M | $261M | $165M | $278M | $299M |
| Diluted EPS | $2.11 | −$1.86 | $2.69 | $2.43 | $2.00 | $1.71 | $2.52 | $2.84 | $3.12 | $1.98 | $3.35 | $3.64 |
| Cash from operations | $276M | $580M | −$29.8M | $561M | $277M | $777M | $18.5M | $621M | $387M | $614M | $192M | $446M |
| Capital expenditure | $105M | $167M | $134M | $128M | $116M | $112M | $126M | $77.9M | $107M | $124M | $121M | $132M |
| Free cash flow | $171M | $412M | −$164M | $433M | $162M | $665M | −$108M | $543M | $281M | $490M | $70.5M | $314M |
| Dividends and buybacks | $1.1B | $70.1M | $62.1M | $60.4M | $136M | $135M | $61.6M | $260M | $84.9M | $284M | $159M | $413M |
This story describes figures the company has published. It is for information only and is not investment advice or a recommendation to buy, sell or hold any security. Check the original filings before relying on any figure. Stoqly is not affiliated with the SEC or Labcorp.